Comprehensive Guide to tcpdump (Part 2)


In the previous article of tcpdump, we learned about some basic functionalities of this amazing tool called tcpdump. If you haven’t check until now, click here.  Hence, in this part, we will cover some of the advance options and data types. So that we can analyze our data traffic in a much faster way.
Table of Content
·         Link level header
·         Parsing and printing
·         User scan
·         Timestamp precision
·         Force packets
§  RADIUS (Remote Authentication Dial-in User Service)
§  AODV (Ad-hoc On-demand Distance Vector protocol)
§  RPC (Remote Procedure Call)
§  CNFP (Cisco NetFlow Protocol)
§  LMP (Link Management Protocol)
§  PGM (Pragmatic General Multicast)
§  RTP (Real-Time Application Protocol)
§  RTCP (Real-Time Application Control Protocol)
§  SNMP (Simple Network Management Protocol)
§  TFTP (Trivial File Transfer Protocol)
§  VAT (Visual Audio Tool)
§  WB (Distributed White Board)
§  VXLAN (Virtual Xtensible Local Area Network)
·         Promiscuous mode
·         No promiscuous mode
Link level header
Tcpdump provides us the option to showcase link-level headers of each data packets. We are using -e parameter to get this information in our data traffic result. Generally, by using this parameter, we will get MAC address for protocols such as Ethernet and IEEE 802.11.
tcpdump -i eth0 -c5
tcpdump -i eth0 -c5 -e
Parsing and printing
As we all know that, the conversation of a concrete syntax to the abstract syntax is known as parsing. The conversation of an abstract syntax to the concrete syntax is called unparsing or printing. Now to parse a data packet we can use -x parameter and to print the abstracted syntax, we can use -xx parameter. In addition to printing the headers of each data packets, we can also print the packet in hex along with its snaplen.
tcpdump -i eth0 -c 2 -x
tcpdump -i eth0 -c 2 -xx

If we want this information provided by -x parameter along with their ASCII code then we need to use -X parameter and if we want the results of -xx parameter along with their ASCII codes then we need to use -XX parameter. To use these parameters in our Data analysis, use the following commands:
tcpdump -i eth0 -c 2 -X
tcpdump -i eth0 -c 2 -XX

User scan
If we are running tcpdump as a root then before opening any saved file for analysis, you will observe that it changes the user ID to the user and the group IDs to the primary group of its users.
Tcpdump provides us -Z parameter, through which we can overcome this issue but we need to provide the user name like the following:
tcpdump -i eth0 -c 2 -Z root
tcpdump -i eth0 -c 2 -Z kali
There is one more way to do this, i.e. with the help of –relinquish-privileges= parameter.  
Timestamp precision
Timestamp is the time registered to a file, log or notification that can record when data is added, removed, modified or transmitted. In tcpdump, there are plenty of parameters that move around timestamp values like -t, -tt, -ttt, -tttt, -ttttt, where each parameter has its unique working and efficiency.
·         -t parameter which must don’t print a timestamp on each dump line.
·         -tt parameter which can print timestamp till seconds.
·         -ttt parameter which can print a microsecond or nanosecond resolution depending upon the time stamp precision between the current and previous line on each dump line. Where microsecond is a default resolution.
·         -tttt parameter which can print a timestamp as hours, minutes, seconds and fractions of seconds since midnight.
·         -ttttt parameter which is quite similar to the -ttt parameter. It can able to delta between current and first line on each dump line.
To apply these features in our scan we need to follow these commands:
tcpdump -i eth0 -c 2
tcpdump -i eth0 -c 2 -t
tcpdump -i eth0 -c 2 -tt
tcpdump -i eth0 -c 2 -ttt
tcpdump -i eth0 -c 2 -tttt
tcpdump -i eth0 -c 2 -ttttt

Force packets
In tcpdump, we can force our scan of data traffic to show some particular protocol. When using the force packet feature, defined by selected any “expression” we can interpret specified type. With the help of the -T parameter, we can force data packets to show only the desired protocol results.
The basic syntax of all force packets will remain the same as other parameters -T followed by the desired protocol. Following are some protocols of force packets:
·         RADIUS – RADIUS stands for Remote Authentication Dial-in User Service. It is a network protocol, which has its unique port number 1812, provides centralized authentication along with authorization and accounting management for its users who connect and use the network services. We can use this protocol for our scan.

tcpdump -i eth0 -c5 -T radius


·         AODV – Adhoc On-demand Distance Vector protocol, is a routing protocol for mobile ad hoc networks and other wireless networks. It is a routing protocol that is used for a low power and low data rate for wireless networks. To see these results in our scan follow.

tcpdump -i eth0 -c5 -T aodv


·         RPC – Remote procedure call, it is a protocol that one program can use to request service from a program located in another computer on a network without having to understand the network details. A procedure call is also known as a function call. For getting this protocol in our scan use the following command:

tcpdump -i eth0 -c5 -T rpc

·         CNFP – Cisco NetFlow protocol, it is a network protocol developed by cisco for the collection and monitoring of network traffic, flow data generated by NetFlow enabled routers and switches. It exports traffic statistics as they record which are then collected by its collector. To get these detailed scans follow this command.

tcpdump -i eth0 -c5 -T cnfp


·         LMP – Link Management Protocol, it is designed to ease the configuration and management of optical network devices. To understand the working of LMP in our network, we need to apply this protocol in our scan.

tcpdump -i eth0 -c5 -T lmp

·         PGM – Pragmatic general multicast, it is a reliable multicast network transport protocol. It can provide a reliable sequence of packets to multiple recipients simultaneously. Which further makes it suitable for a multi-receiver file-transfer. To understand its working in our data traffic follows.
tcpdump -i eth0 -c5 -T pgm


·         RTP – Real-time application protocol, it can code multimedia data streams such as audio or video. It divides them into packets and transmits them over an IP network. To analyze this protocol in our traffic we need to follow this command:

tcpdump -i eth0 -c5 -T rtp


·         RTCP – Real-time application control protocol, this protocol has all the capabilities of RTP along with additional control. With the help of this feature, we can control its working in our network environment. To understand the working of this protocol in our data traffic apply these commands.
tcpdump -i eth0 -c5 -T rtcp

·         SNMP – Simple Network Management Protocol, is an Internet standard protocol for collecting and organizing information about managed devices on IP networks for modifying that information to change device behavior. To see its working in our traffic, apply this command.

tcpdump -i eth0 -c5 -T snmp


·         TFTP - Trivial File Transfer Protocol, is a simple lockstep File transfer protocol that allows its client to get a file from a remote host. It is used in the early stages of node booting from a local area network. To understand its traffic, follow this command.

tcpdump -i eth0 -c5 -T tftp


·         VAT - Visual Audio Tool, is developed by Van Jacobson and Steven McCanne. It is an electronic media processing for both sound and a visual component. To understand its data packets in our traffic we need to apply these commands.

tcpdump -i eth0 -c5 -T vat


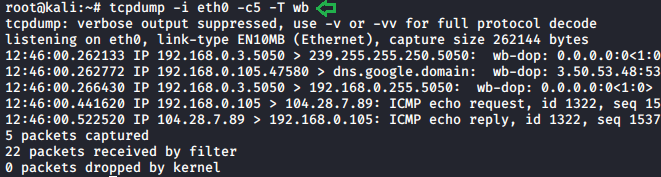
·         WB – Distributed whiteboard, the program allows its users to draw and type the messages onto canvas, this should be synchronized to every other user that is on the same overlay network for the applications. New users should also receive everything that is already stored on the whiteboard when they connect. To understand its data packets, follow this command.

tcpdump -i eth0 -c5 -T wb


·         VXLAN - Virtual Xtensible Local Area Network, is a network virtualization tech that attempts to address the scalability problems associated with a large cloud computing area. It is a proposed Layer 3 encapsulation protocol that will make it easier for network engineers to scale-out cloud computing. To understands its data traffic follows these commands.

tcpdump -i eth0 -c5 -T vxlan

These are some of the protocol which is used under forced packets parameter to get the fixed desired data traffic from scan.
Promiscuous Mode
In computer networks, promiscuous mode is used as an interface controller that will cause tcpdump to pass on the traffic it receives to the CPU rather than passing it to the promiscuous mode, is normally used for packet sniffing that can take place on a part of LAN or router.
To configure promiscuous mode by following these commands.
ifconfig eth0 promisc
ifconfig eth0
After enabling the promiscuous mode in our network, let us capture some packets with the help of this by applying these commands.
tcpdump -i eth0 -c 10
No Promiscuous Mode
In the previous parameter, we learned about the promiscuous mode that means a network interface card will pass all frames received to the OS for processing versus the traditional operation where only frames destined for the NIC’s MAC address or a broadcast address will be passed up to the OS. Generally, promiscuous mode is used to “sniff” all traffic on the wire. But if we want to switch to multicast mode against the promiscuous mode. Then we need to use –no-promiscuous-mode parameter, which helps us to which the mode without changing the network settings.
tcpdump -i eth0 -c 5 --no-promiscuous-mode
This is the second part of the series. So, get familiar with these features and stay tuned for some advance features of tcpdump in our next article.
Author: Shubham Sharma is a Pentester, Cybersecurity Researcher, Contact Linkedin and twitter.


Comprehensive Guide to tcpdump (Part 1)


In this article, we are going to learn about tcpdump. It is a powerful command-line tool for network packet analysis. Tcpdump helps us troubleshoot the network issues as well as help us analyze the working of some security tools.
Table of Content
·         Introduction
·         Available Options
·         List of interfaces
·         Default working
·         Capturing traffic of a particular interface
·         Packet count
·         Verbose mode
·         Printing each packet in ASCII
·         Don’t convert address
·         Port filter
·         Host filter
·         The header of each packet
·         TCP sequence number
·         Packet filter
·         Packet Direction
·         Live number count
·         Read and Write in a file
·         Snapshot length
·         Dump mode
Introduction
Tcpdump was originally developed in 1988 by Van Jacobson, Sally Floyd, Vern Paxson, and Steven McCanne. They worked at the Lawrence Berkeley Laboratory Network Research Group.
It allows its users to display the TCP/IP and other packets being received and transmitted over the network. It works on most of the Linux based operating systems. It uses the libpcap library to capture packets, which is a C/C++ based library. Tcpdump has a windows equivalent as well. It is named windump. It uses a winpcap for its library.
Available Options
We can use the following parameter to print the tcpdump and libpcap version strings. Also we can print a usage message that shows all the available options.
tcpdump -h
tcpdump --help


List of interfaces
An interface is the point of interconnection between a computer and a network. We can use the following parameter to print the list of the network interfaces available on the system. It can also detect interfaces on which tcpdump can capture packets. For each network interface, a number is assigined. This number can be used with the ‘-i’ parameter to capture packets on that particular interface.
There might be a scenario where the machine that we are working on, is unable to list the network interfaces it is running. This can be a compatibity issue or something else hindering the execution of some specific commands (ifconfig -a).
tcpdump –list-interface
tcpdump -D
Default Capture
Before
tcpdump

Capturing traffic of a particular interface
We will be capturing traffic using the ethernet network which is known as “eth0”. This type of interface is usually connected to the network by a category 5 cable.
To select this interface we need to use -i parameter.
tcpdump -i eth0
Packet count
Tcpdump has some amazing features which we can use to make our traffic analsis more efficient. We can access some of these features using various parameters. We use the -c parameter, it will help us to capture the exact amount of data that we need and display those. It refines the amount of data we captured.
tcpdump -i eth0 -c10

Verbose mode
The verbose mode provides the information regarding the traffic scan. For example, time to live(TTL), identification of data, total length and available options in an IP packets. It enables additional packet integrity checks such as verifying the IP and ICMP headers.
To get extra information from our scan we need to use -v parameter.
tcpdump -i eth0 -c 5 -v
Printing each packet in ASCII
ASCII is abbreviation of American Standard Code for Information Interchange. It is a character encoding standard for electronic communication. ASCII codes represent the text in computers and other devices. Most of the modern character encoding techniques were based on the ASCII codes. To print each packet in ASCII code we need to use -A parameter.
tcpdump -i eth0 -c 5 -A
Don’t convert address
With the help of the tcpdump -nn parameter, we can see the actual background address without any filters. This feature helps us to understand the data traffic better without any filters.
tcpdump -i eth0 -c 5
tcpdump -i eth0 -c 5 -nn
Port filter
Port filter helps us to analyze the data traffic of a particular port. It helps us to  monitor the destination ports of the TCP/UDP or other port-based network protocols.
tcpdump -i eth0 -c 5 -v port 80
Host filter
This filter helps us to analyze the data traffic of a particular host. It also allows us to stick to a particular host through which further makes our analyzing better. Multiple parameter can also be applied, such as -v, -c, -A,-n, to get extra information about that host.
The header of each packet
The header contains all the instructions given to the individual packet about the data carried by them. These instructions can be packet length, advertisement, synchronization, ASCII code, hex values, etc. We can use -X parameter to see this information of our data packets.
TCP sequence number
All bytes in TCP connections has there sequence number which is a randomly chosen initial sequence number (ISN). SYN packets have one sequence number, so data will begin at ISN+1. The sequence number is the byte number of data in the TCP packet that is sent forward. -S parameter is used to see these data segments of captured packets.

Packet filter
Another feature that is provided by tcpdump is packet filtering. This helps us to see the packet results on a particular data packet in our scan. If we want to apply this filter in our scan we just need to add the desired packet in our scan.

Packet directions
To the direction of data flow in our traffic, we can use the following parameter :
tcpdump -i eth0 icmp -c 5 -Q in

To see all the requests which we are sending to the server  following (- Q out) parameter can be used:
tcpdump -i eth0 icmp -c 5 -Q out
Live number count
We can apply live number count feature to see how many packets were scanned or captured during the data traffic scans. --number parameter is used to count the number of packets that are being captured in a live scan. We also comparing packet count to live number count to see its accuracy.
Read and write in a file
In tcpdump, we can write and read into a .pcap extension file. Write (-w) allow us to write raw data packets that we have as an output to a standard .pcap extension file. Where as read option (-r) helps us to read that file. To write output in .pcap follow:
tcpdump -i eth0 icmp -c 10 -w file.pcap
to read this .pcap file we follow:
tcpdump -r file.pcap

Snapshot length
Snapshot length/snaplen is refered to the  bytes of data from each packet. It is by default set on the 262144 bytes. With tcpdump, we can adjust this limit to our requirement to better understand it in each snap length. -s parameter helps us to do it just apply -s parameter along with length of bytes.
tcpdump -i eth0 icmp -s10 -c2
tcpdump -i eth0 icmp -s25 -c2
tcpdump -i eth0 icmp -s40 -c2
tcpdump -i eth0 icmp -s45 -c2
Dump mode
Dump mode has multiple parameters like -d, -dd, -ddd. Where -d parameter, dumps the compiled matching code into a readable output, -dd parameter, dumps the code as a C program fragments. -ddd parameter and dumps code as a decimal number with a count. To see these results in our scan we need to follow:
tcpdump -i eth0 -c 5 -d
tcpdump -i eth0 -c 5 -dd
tcpdump -i eth0 -c 5 -ddd
This is our first article in the series of comprehensive guide to tcpdump. Which is based on some basic commands of tcpdump. Stay tuned for more advance option in this amazing tool.
Author: Shubham Sharma is a Pentester and a Cybersecurity Researcher, contact LinkedIn and Twitter.  

Major Key Components of Threat Hunting


We all know the proactive threat hunting is need hour and as we have already discussed all basic requirement that highlights all generic step required for Threat Hunting Activity in our previous article “Threat Hunting – A proactive Method to Identify Hidden Threat”.
In this post, you will learn what are the main factors that should be considered before conducting a threat hunting activity in any organisation. These key factors will help an organisation to prepare a roadmap of activity before execution.
Table of Content
·         The pyramid of Pain
·         Threat Hunting Techniques
·         Datasets
·         Hunting Maturity Model (HMM)

The Pyramid of Pain
The Pyramid of Pain, first proposed by security professional David J Bianco in 2013, concentrating on incident response and threat hunting in order to improve the applicability of attack indicators.
·         The Pyramid measures potential usefulness of your intel
·         It also measures difficulty of obtaining that intel
·         The higher you are, the more resources your adversaries have to expend.

For example: If an attacker is using malware to exploit an endpoint within their attack chain and as a defender the security professional are using file hash values to distinguish such actions, it is trivial for them to recompile the malware illustration such that the file hash value the team are using to detect the original sample, is rendered useless.


Hash Values: Identifying Indicator of compromised with the help of the corresponded hash values is most trivial step. Unfortunately, they are extremely susceptible to change (even accidentally).
IP Addresses: An IPv4 or IPv6 address, in most cases netblocks or CIDR ranges also fit here.
Only foolish person uses their own addresses. VPNs, Tor, open proxies all make it easy to change the IP address.
If it’s hardcoded into a config, maybe adversaries have to do a little work to update it. We have found that attackers have begun to manipulate or confuse targets with malicious IP in DWORD format. The definition of a malicious URL is as follows:
“hxxp:// 77683606/GoogleSearch.image”
IP to DWORD format
1)  This can be done by separating the original IP in to four octets. Let’s take the above IP address, which is “74.21.11.150”. Split the IP address into four octets - 74, 21, 11 and 150.
2) Covert each octet into HEX and you will get “4a15b96” for all four octets.
3) Further change HEX “4a15b96” into decimal and ultimately you will get “77683606” which is the DWORD form of the IP address.

Domain Names: This could be either a domain name itself (e.g., “freeinternet.net”) or maybe even a sub- or sub-sub-domain (e.g., “the.new.game.freeinternet.net”).
The attackers use the fast flux or double flux to mask and safeguard their actual infrastructure. They compromised a range of easy targets like vulnerable computers or weak home routers. These routers are then used as tunnels for carrying command-control messages and data across the actual network
As per a report “APT1: Exposing One of China’s Cyber Espionage Units | Mandiant | FireEye” you can read how an attacker plan to get domain registered for APT1.
1) The first persona, “UglyGorilla”, has been active in computer network operations since October 2004. His activities include registering domains attributed to APT1 and authoring malware used in APT1 campaigns. “UglyGorilla” publicly expressed his interest in China’s “cyber troops” in January 2004.
2)  The second persona, an actor we call “DOTA”, has registered dozens of email accounts used to conduct social engineering and spear phishing attacks in support of APT1 campaigns. “DOTA” used a Shanghai phone number while registering these accounts.
3)  We have observed both the “UglyGorilla” persona and the “DOTA” persona using the same shared infrastructure, including FQDNs and IP ranges that we have attributed to APT1
Network/Host Artifacts: It is very difficult for an adversary to conduct any useful operation without leaving any traces, which ensures that any byte flowing through the network as a result of an adversary's involvement may be an artifact.
For example, Classify the outbound traffic with a C&C server that will be viewed as network artifacts, while on hosts, search for files & folders, registry objects, mutexes, memory strings will be consider as host artifacts.
Tools: In this step, the hunter tries to investigate "what kind of program or command might be used by intruders to achieve their target" such as powershell, mimikatz, or other restriction circumvent commands for a lateral moment.
Tactics, Techniques and Procedures (TTPs): In this phase, the hunter attempts to examine "how the intruder achieves its target with the aid of the cyber-kill-chain" (as discussed in Part-I). They choose social engineering to target such as phishing, which is the most common TTP used to trap the user in order to gain a foothold in the network by linking a malicious object to the mail.

Skilled threat hunters use a variety of techniques when reviewing data sources such as firewall logs, SIEM and IDS warnings, DNS logs, file and network data, authentication systems, and other sources in order to detect IoCs and recognize the threat.


SEARCHING
This is the simplest and least difficult technique used in threat hunting. It is the process for querying data for specific artifacts using a defined search criteria and tools. It involves environmental data to analyze like logs, alerts, memory dumps, system events etc. As security professional who involves in threat hunt need to analyze more data so in starting of threat searching, it’s not possible to know exactly what you are looking for. So, there are the two important factors need to keep in mind while doing a search:
  • Too wide hunting for common artifacts that can produce unnecessarily various results of very little use.
  • Focusing too specifically will lead to a very few findings and prevent it from being concluded.
CLUSTERING
Clustering is an analytical process, typically performed using machine learning, involving the classification of related classes (or clusters) of data points based on certain behaviors from a wider range of data. In actual fact, the technique is popular in various fields such as the machine learning, pattern recognition, retrieval of information, data compression and computer graphics, for statistical data analytics.


source: https://en.wikipedia.org/wiki/Cluster_analysis
A statistical technique in which groups of like data points established on specific aspects of a large data set are separated into groups. This is most effective when acting upon a broad group of data points that do not share behavioral characteristics. Clustering finds precise cumulative behaviors, like an unusual number of instances of a common occurrence through various applications such as outlier detection.
GROUPING
Grouping includes taking a variety of different objects and determining when multiple objects come together based on common criteria. This consists of identifying common criteria that are used to group objects, such as incidents that occur within a given time period. It is best used when hunting for other artifacts which are equally or unusual.
The grouping is different from clustering as it is performed after clustering by looking at unusual data sets and of the researcher's concern in order to see the root cause whereas clustering uses enormous quantities of data to classify data sets which require more analysis using the grouping technique.
STACKING
The stack counting is an analysis method used in a simulated haystack to find the needle. It is most popular practice conducted by hunters to examine a hypothesis.
“You are familiar with the term, if you ever used the pivot tables of Microsoft Office, the stats command of Splunk or the "top" command of Arcsight”.
Data stacking is used to isolate and classify patterns by using frequency analyses in mass quantities of related data. It requires an algorithmic method of reducing vast volumes of data that can be processed and analyzed into manageable chunks.
In the context of a large data set, the investigator identifies the characteristics that differentiate the odd data rows and may prove that they are malicious. Instead, these attributes are the grouping parameters used to build estimates for the frequency analysis.
For example: To identify a thread count with the help of Process Explorer.


Datasets
The methods you use are all part of the strategy and experience of what you will do. If you don't have sufficient details, but what is the right details, you can't hunt? The response to that question is dependent on what you are aiming for, but the following is a broad list of datasets that are well suited for hunting and security:


The Hunting Maturity Model is developed by Sqrrl’s security architect and DavidJBianco. It measures current maturity level of hunting of any organization based on the data collection, create data analysis procedures, incident responses and hunting automation.
There are five levels of Hunting Maturity Model (HMM)
Increasing level of maturity is focused on how an organization has the ability to track and establish data analysis procedures (DAP) on the basis of the data it collects and their hunting automation. Analysts and managers will use the HMM to assess the current maturity and to build a roadmap.
HM0 – INITIAL: At HM0 uses automated alerting tools, such as IDS, SIEM or antiviruses, mainly to identify malicious activities across the organization. They may provide signature update feeds or indicators of threats and even build their signatures or indicators, but these are fed directly into monitoring system.
HM1-Minimal: An organization in HM1 still relies mainly on automatic warnings, but at least some routine IT data collection is carried out by them. They also utilize threat intelligence to drive
detection.
HM2-Procedural: At Level 2 maturity, an organization follows analysis procedures created by others. It has a high or very high level of routine data collection. They may periodically practice and adapt procedures developed by others and can make minor improvements but are not yet able to establish entirely new guidelines themselves.
HM3-Innovative:  At least a few hunters are present in HM3 organizations who understand different forms of data analysis techniques and are able to use these approaches to detect malicious activities. Such organizations are typically those which establish and publish procedures rather than depend upon procedures established by other parties (as in the HM2 case).
HM4-Leading:  HM4 is exactly the same as HM3, with a significant difference: automation. Every effective hunting process at HM4 will be introduced and translated into automatic detection. This liberates analysts from the pressure of continued implementation of the same processes and encourages them then to focus on developing current or new processes.


Reference: