Showing posts with label Cyber Forensics Tools. Show all posts

Forensic Investigation: Shellbags

In this article, we will be focusing on shellbags and its forensic analysis using shellbag explorer. Shellbags are created to enhance the users’ experience by remembering user preferences while exploring folders, the information stored in shellbags is useful for forensic investigation.

Table of Contents

·         Introduction

·         Location of shellbags

·         Forensic analysis using Shellbags Explorer

·         Active Registry Analysis

·         Offline Registry Analysis


 Introduction

Windows Shell Bags were introduced into Microsoft's Windows 7 operating system and are yet present on all later Windows platform. Shellbags are registry keys that are used to improve user experience and recall user’s preferences whenever needed. The creation of shellbags relies upon the exercises performed by the user.

As a digital forensic investigator, with the help of shellbags, you can prove whether a specific folder was accessed by a particular user or not. You can even check whether the specific folder was created or was available or not. You can also find out whether external directories have been accessed on external devices or not.

For the most part, Shell Bags are intended to hold data about the user's activities while exploring Windows. This implies that if the user changes icon sizes from large icons to the grid, the settings get updated in Shell Bag instantly. At the point when you open, close, or change the review choice of any folder on your system, either from Windows Explorer or from the Desktop, even by right-clicking or renaming the organizer, a Shellbag record is made or refreshed.

Location of shellbags

Windows XP

The shellbags for Windows XP are stored in NTUSER.DAT

·         Network folders references:\Software\Microsoft\Windows\Shell

·         Local folder references: \Software\Microsoft\Windows\ShellNoRoam

·         Removable device folders: \Software\Microsoft\Windows\StreamMRU

Windows 7 to Windows 10

Shellbags are a set of subkeys in the UsrClass.dat registry hive of Windows 10 systems. The shell bags are stored in both NTUSER.DAT and USRCLASS.DAT.

·         NTUSER.DAT: HKCU\Software\Microsoft\Windows\Shell

·         USRCLASS.DAT: HKCU\Software\Classes\Local Settings\Software\Microsoft\Windows\Shell

The majority of the data is found in the USRCLASS.DAT hive-like local, removable, and network folders’ data.

You can manually check shellbags entry in the registry editor like so. In the following screenshot, a shellbag entry for a folder named jeenali is shown.


The Shellbag data contains two main registry keys, BagMRU and Bags

·         BagMRU: This stores folder names and folder path similar to the tree structure. The root directory is represented by the first bagMRU key i.e. 0. BagMRU contains numbered values that compare to say sub key’s nested subkeys. All of these subkeys contain numbered values aside from the last child in each branch.

·          Bag: These stores view preference such as the size of the window, location, and view mode.


We will be analyzing the shellbags using the shellbag explorer.

1.       ShellBags explorer(SBECmd)

2.       Shellbags explorer (GUI version)

Shellbags explorer is a tool by Eric Zimmerman to analyze shellbags. The shellbags explorer is available in both versions cmd and GUI. You can download the tool from here.

Forensic Analysis of Shellbag

Analysis using SBECmd

Here we are using the SBECmd.exe (Cmd version of the shellbag explorer tool) by Eric Zimmerman. This cmd tool is great for command prompt lovers who prefer using commands over GUI.

To get a clear idea about how shell bags work and store data and how you can analyze it I have created a new folder named “raaj” which consists of a text document. Further, we will be renaming it to geet and then to jeenali. Let’s analyze the shellbags entries for this.


Run the executable file and browse to the directory where the executable is present. To extract the shellbags data into a .csv file use the following command:

SBECmd.exe –l –csv ./


As a result of the above command, a .csv file will be created in the directory.


Lets’ open the .csv file and analyze it.


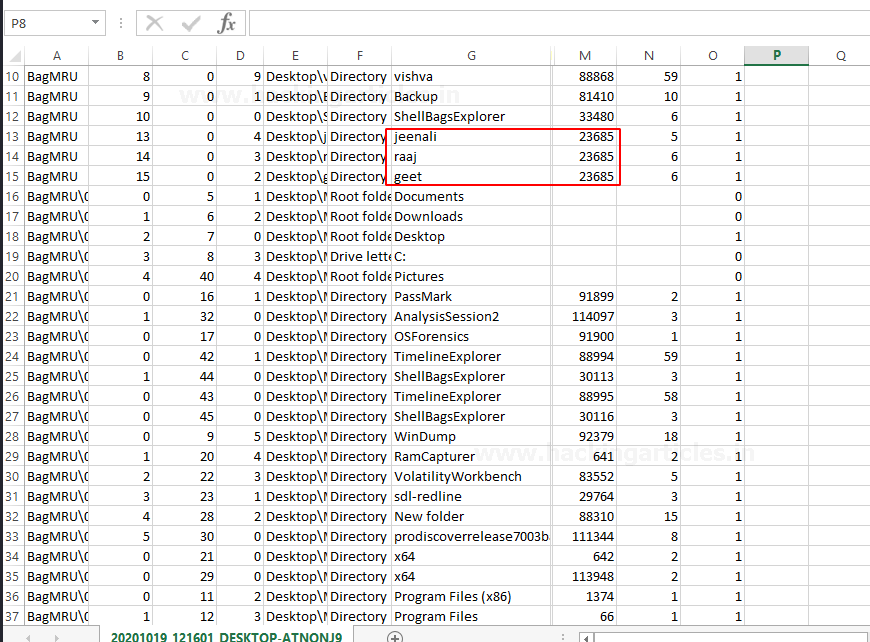
As I mentioned earlier we have renamed the folder named “raaj” to “geet” and further to “jeenali” as highlighted in the screenshot the MFT entry number is the same for all three folders which depict that the folder was renamed. 

v  Shellbags explorer (GUI version)

Active Registry Analysis

Using the shellbags explorer we can also analyze the active registry. Select load an active registry which will load the registry in use by the active user.


The shellbags are successfully parsed from the active registry.


The shellbags parsed contains the shellbags entries created based on users’ activities. As depicted earlier the folder renamed will have a similar MFT entry number. I have created a folder named “raaj”, we will be further renaming it to “geet”.


Whenever a folder is renamed an entry is stored in shellbag, the MFT entry number of both the folder will be the same.


Now lets’ once again rename the folder to jeenali. The MFT entry will be similar to the previous one.


Offline registry analysis

For offline analysis, we first have to extract the shellbags file which is USRCLASS.DAT. Let’s extract the shellbag file using FTK imager. Download FTK imager from here.

Lets’ add in the evidence, go to the add evidence item.


Select the source for adding evidence here I have select the local drive as the usrclass.dat as the


Select the desired user drive. Click Finish.


Expand the window to the location of the usrclass.dat.Select the user you want to investigate go to the following path to extract the UsrClass.dat.

root > users > administrator >Appdata>Local>Microsoft>windows


We will be analyzing the usrclass.dat extracted from the above step using shell bag explorer by Eric Zimmerman.

As we have exported the registry hives we will choose “load offline hive


After successful parsing of the extracted shellbags file, you will be able to see the entries for folders browsed, created, deleted, etc. Here is the entry of the folders renamed earlier, the MFT entry number is the same for the three folders.


Further, I deleted the folder named “jeenali”. Now lets’ check the shellbags data whether the deleted folder still exists. 


Yes, the shellbags store the entry even though the folder was deleted later.


Shellbags stores the entries of the directories accessed by the user, user preferences such as window size, icon size. Shellbags explorer parses the shellbags entries shows the absolute path of the directory accessed, creation time, file system, child bags. The tool classifies the folders accessed according to the location of the folder. Shellbags are created for compressed files (ZIP files), command prompt, search window, renaming, moving, and deleting a folder.

Forensic Investigation: Pagefile.sys

In this article, we will learn how to perform a forensic investigation on a Page File. There is a lot of information that can be extracted from valuable artifacts through a memory dump. Yet, there is more: you can perform memory forensics even without a memory dump that is by virtual memory analysis.

There are records on the drive that contain a few pieces of memory. These files are pagefile.sys, swapfile.sys, and hiberfil.sys. We will be moving forward with pagefile.sys.


Table of Contents

·         Introduction

·         Capturing the memory and pagefile using FTK imager

·         Analyzing using Belkasoft Evidence Centre

Introduction

The Pagefile.sys also referred to as a swap file or virtual memory file is utilized inside Windows operating frameworks to store information from the RAM when it turns out to be full. The pagefile.sys in Windows operating framework is located at C:\pagefile.sys. Windows OS supports up to 16 paging files; only one is used currently.

At whatever point you open an application in Windows, your PC will consume RAM. At the point when you have more applications open than the RAM on your PC can deal with, programs previously running in the RAM are moved to the Page file. This is known as Paging and implies the Page file goes about as reinforcement RAM, also known as virtual memory.

Capturing the memory and pagefile using FTK imager

We will use FTK Imager to capture the memory along with the pagefile.sys.

FTK® Imager is a tool for imaging and data preview FTK Imager also create perfect copies (forensic images) of computer data without making changes to the original evidence. You can download FTK imager from here.

Click on capture memory to create a memory dump.


The next step is to browse the destination path as you like, select the alternative “include pagefile” and click on Capture Memory.


The memory capture process will begin once you click on capture memory.


After completion of the process, the memory dump and page file will be carved in the destination folder previously selected.


Analyzing using Belkasoft Evidence Centre

Now to analyze the carved file we will be using the tool, Belkasoft Evidence Centre for analysis of the pagefile.sys. Belkasoft Evidence Centre is an all-in-one forensic tool for acquiring analyzing and carving digital evidence. You can download the free trial of the tool from here.

 First of all, let's create a new case. Fill in the case information, select the root folder, if you want, you can add a case description as well. Click on create and open to proceed further with the analysis. 


To analyze the captured memory (pagefile), select the option RAM Image; add the pagefile.sys file you carved previously as the evidence source using FTK imager.


Choose the desired data type you would like to search for. There are a whole lot of data types supported by the tool. Click finish afterward.


Here is the dashboard for the case after completion of the above steps. It shows proper segregated information about the data carved from the pagefile. A total of 1097 files have been carved, which includes URLs, pictures, and other artifacts.


The case explorer tab right next to the dashboard tab allows expanding and viewing each profile column. The data has been carved from browsers, pictures, system files, and other files as well.


Let’s expand and analyze the Browsers profile. It has carved the chrome history which consists of URLs, let’s check the chrome carved section for more details. It consists of the URLs for the sites visited, one of which is highlighted in the following screenshot.


Another in browsers profile is opera. Analyze the opera(carved) profile similarly, shows details about the URLs visited.


The carved data from pagefile also consists of some images. These images can be from the sites I have visited and other thumbnails.


The great feature of the belkasoft evidence center is it allows you to simply right on the picture and analyzes it for various aspects such as check skin, detect pornographic content from the picture, detect text, and also faces. All these aspects are useful during live analysis.


Some system files are also carved from the captured virtual memory, show the NetBIOS name, file path, and size.


The timeline tab shows the overall view of the data carved for easy analysis along with the time and URL of the search site visited.


A search results tab is also there in the tool which shows predefined search results. The following screenshot shows the search engine results along with the link and profile name. 


Similarly, you can perform the forensic investigation for hiberfil. Export the hiberfil.sys (stores the data while the windows system is on Hibernate mode) using FTK located at C:/hiberfile.sys and further analyze it using Belkasoft Evidence Centre.

The analysis of virtual memory files serves a great purpose for web browser forensic.

Forensic Investigation : Prefetch File

In this article, we are going to study an important artifact of Windows, i.e. prefetch files. Everytime you do anything on your Windows system, a file is created. These files are called Prefetch files. Through this article, we will learn how these are important and why do we need them.

Table of Contents

·         Introduction

·         Forensic Analysis of Prefetch Files

o   WinPrefetch View

o   OS Forensic

o   PECmd

o   FTK Imager

Introduction

A Prefetch file is a file created when you open an application on your windows system. Windows makes a prefetch record when an application is run from a specific area for the absolute first time.

Prefetch files were introduced in Windows XP. Prefetch files are intended to accelerate the Windows boot process and applications' start-up process. In Windows XP, Vista, and 7 the number of prefetch files are limited to 128 whereas in Windows 8 and above it is up to 1024.

Proof of program execution can be a significant asset for a forensic investigator, they can prove that a certain executable was executed on the system to cover up the tracks. Before initiating the forensic analysis of the prefetch record as a forensic examiner you should check whether the prefetching process is enabled.

To check the status of prefetching, open the following location in Registry editor:

Computer\HKEY_LOCAL_MACHINE\SYSTEM\CurrentControlSet\Control\Session Manager\Memory Management\PrefetchParameters


The value is set as 3 by default as shown in the image above. The following values can be changed according to your prefetching needs. All the options that windows provide us with in order to customize prefetching are explained below:

·         0:Prefetching Disabled

·         1:Application Prefetching Enabled

·         2: Boot Prefetching Enabled

·         3:Application and Boot both Enabled

The metadata that can be found in a single prefetch file is as following:

·         Executable's name

·         Eight character hash of the executable path.

·         The path of the executable file

·         Creation, modified, and accessed timestamp of executable

·         Run count (Number of time the application has been executed)

·         Last run time

·         The timestamp for the last 8 run time (1 last run time and other 7 other last run times)

·         Volume information

·         File Referenced by the executable

·         Directories  referenced by the executable

The prefetch files are saved under %SystemRoot%\Prefetch (C:\Windows\Prefetch). 


You can open the prefetch files location you can directly search for “prefetch “in the run command.


It can also be opened as a directory from the command prompt, which is a good news for all the command-line lovers.


Forensic Analysis of Prefetch Files

WinPrefetch View

WinPrefetch View is a tool to read and examine the prefetch files stored in your system. The tool was developed by Nirsoft. This utility deals with any variant of Windows, beginning from Windows XP to Windows 10.

You can download the tool from here.


You can easily open the details of a particular prefetch file by simply clicking on it. Here, I have opened HFS.EXE-D3CAF0BF.pf for a detailed view. It shows details such as created time, modified time, file size, the path of process run count, last run time, missing process.


OS Forensics

OS Forensic is a digital forensic tool, a complete package for forensic investigation by Passmark software. It is used to extract, analyze data, search files, recover deleted passwords, and recover deleted evidence, much more.

Download the tool from here.


Prefetch Explorer Command Line (PECmd)

PECmd is a command-line tool by Eric Zimmerman, used for bulk analysis of prefetch files.This tool can also export your prefetch artifacts to .csv and .css.

You can download the tool from here.

To begin with run the executable file. Let’s parse the prefetch file using this tool we will use the –d parameter to parse all the prefetch file.

PECmd.exe –d “C:\Windows\Prefetch”


In the image below, you can see the prefetch file for firefox.exe.The tool has parsed all the metadata as it has been explained in the introduction.


Similarly, through the following image, you can observe the prefetch file for
HFS.exe. Such files will be created for every application you access.


FTK Imager

As a Forensic Investigator, you can always access the prefetch files to understand the case given to you. Because through these files, it can be determined that what was frequently used on the system that you are investigating. This can be easily done with FTK Imager. FTK imager allows one to view and analyze the prefetch file present in the drive. To access the prefetch file through FTK, just open the said tool and look for the Prefetch folder in the left panel as highlighted in the image below:

This is all on prefetch files. Now that we understand these files properly, we can customize it, access it, and use it as we need. The most important thing to know about prefetch files is that it a boon when comes to retracing a malware as any .exe file that has been run on the system, will be logged in prefetch files. Therefore, if a malicious file is executed; you can track it through this.